

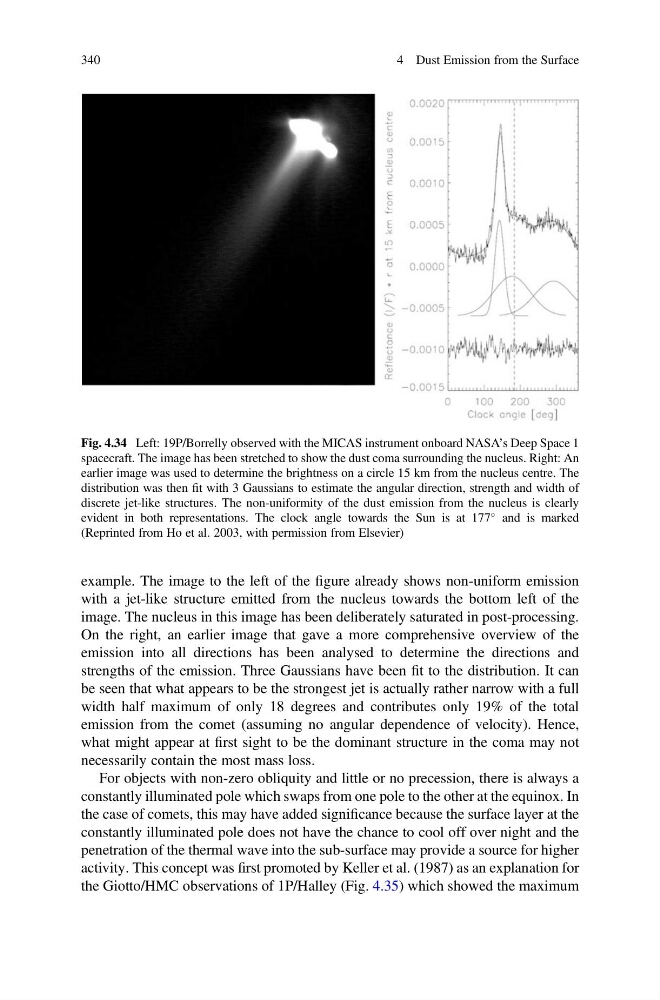
example. The image to the left of the figure already shows non-uniform emission
with a jet-like structure emitted from the nucleus towards the bottom left of the
image. The nucleus in this image has been deliberately saturated in post-processing.
On the right, an earlier image that gave a more comprehensive overview of the
emission into all directions has been analysed to determine the directions and
strengths of the emission. Three Gaussians have been fit to the distribution. It can
be seen that what appears to be the strongest jet is actually rather narrow with a full
width half maximum of only 18 degrees and contributes only 19% of the total
emission from the comet (assuming no angular dependence of velocity). Hence,
what might appear at first sight to be the dominant structure in the coma may not
necessarily contain the most mass loss.
For objects with non-zero obliquity and little or no precession, there is always a
constantly illuminated pole which swaps from one pole to the other at the equinox. In
the case of comets, this may have added significance because the surface layer at the
constantly illuminated pole does not have the chance to cool off over night and the
penetration of the thermal wave into the sub-surface may provide a source for higher
activity. This concept was first promoted by Keller et al. (1987) as an explanation for
the Giotto/HMC observations of 1P/Halley (Fig. 4.35) which showed the maximum
Fig. 4.34 Left: 19P/Borrelly observed with the MICAS instrument onboard NASA’s Deep Space 1
spacecraft. The image has been stretched to show the dust coma surrounding the nucleus. Right: An
earlier image was used to determine the brightness on a circle 15 km from the nucleus centre. The
distribution was then fit with 3 Gaussians to estimate the angular direction, strength and width of
discrete jet-like structures. The non-uniformity of the dust emission from the nucleus is clearly
evident in both representations. The clock angle towards the Sun is at 177
and is marked
(Reprinted from Ho et al. 2003, with permission from Elsevier)
340
4 Dust Emission from the Surface
with a jet-like structure emitted from the nucleus towards the bottom left of the
image. The nucleus in this image has been deliberately saturated in post-processing.
On the right, an earlier image that gave a more comprehensive overview of the
emission into all directions has been analysed to determine the directions and
strengths of the emission. Three Gaussians have been fit to the distribution. It can
be seen that what appears to be the strongest jet is actually rather narrow with a full
width half maximum of only 18 degrees and contributes only 19% of the total
emission from the comet (assuming no angular dependence of velocity). Hence,
what might appear at first sight to be the dominant structure in the coma may not
necessarily contain the most mass loss.
For objects with non-zero obliquity and little or no precession, there is always a
constantly illuminated pole which swaps from one pole to the other at the equinox. In
the case of comets, this may have added significance because the surface layer at the
constantly illuminated pole does not have the chance to cool off over night and the
penetration of the thermal wave into the sub-surface may provide a source for higher
activity. This concept was first promoted by Keller et al. (1987) as an explanation for
the Giotto/HMC observations of 1P/Halley (Fig. 4.35) which showed the maximum
Fig. 4.34 Left: 19P/Borrelly observed with the MICAS instrument onboard NASA’s Deep Space 1
spacecraft. The image has been stretched to show the dust coma surrounding the nucleus. Right: An
earlier image was used to determine the brightness on a circle 15 km from the nucleus centre. The
distribution was then fit with 3 Gaussians to estimate the angular direction, strength and width of
discrete jet-like structures. The non-uniformity of the dust emission from the nucleus is clearly
evident in both representations. The clock angle towards the Sun is at 177
and is marked
(Reprinted from Ho et al. 2003, with permission from Elsevier)
340
4 Dust Emission from the Surface