

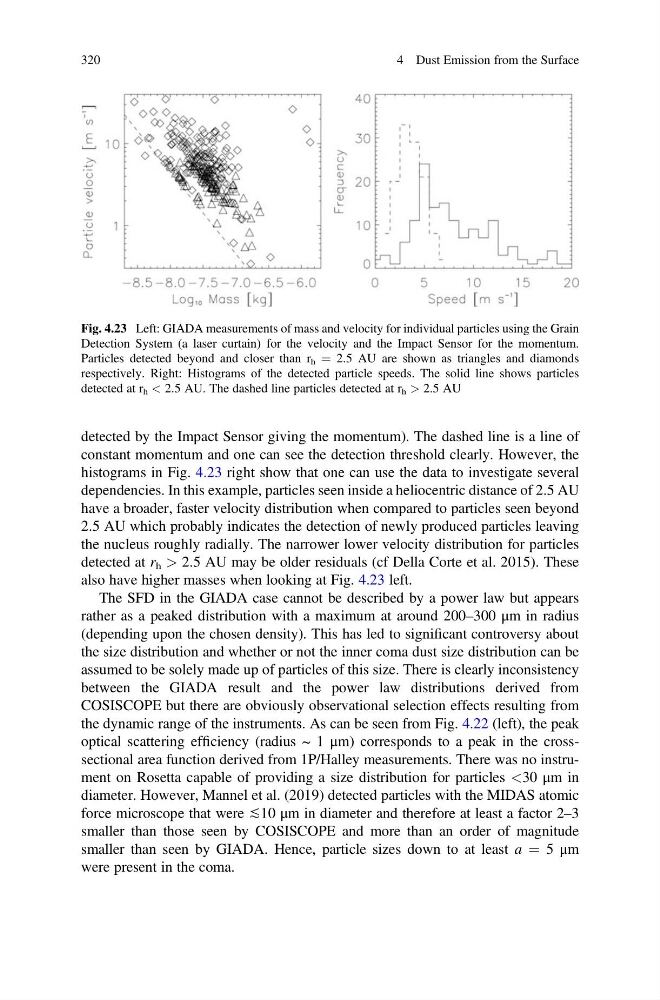
detected by the Impact Sensor giving the momentum). The dashed line is a line of
constant momentum and one can see the detection threshold clearly. However, the
histograms in Fig. 4.23 right show that one can use the data to investigate several
dependencies. In this example, particles seen inside a heliocentric distance of 2.5 AU
have a broader, faster velocity distribution when compared to particles seen beyond
2.5 AU which probably indicates the detection of newly produced particles leaving
the nucleus roughly radially. The narrower lower velocity distribution for particles
detected at r h > 2.5 AU may be older residuals (cf Della Corte et al. 2015). These
also have higher masses when looking at Fig. 4.23 left.
The SFD in the GIADA case cannot be described by a power law but appears
rather as a peaked distribution with a maximum at around 200–300 μm in radius
(depending upon the chosen density). This has led to significant controversy about
the size distribution and whether or not the inner coma dust size distribution can be
assumed to be solely made up of particles of this size. There is clearly inconsistency
between the GIADA result and the power law distributions derived from
COSISCOPE but there are obviously observational selection effects resulting from
the dynamic range of the instruments. As can be seen from Fig. 4.22 (left), the peak
optical scattering efficiency (radius ~ 1 μm) corresponds to a peak in the crosssectional area function derived from 1P/Halley measurements. There was no instrument on Rosetta capable of providing a size distribution for particles <30 μm in
diameter. However, Mannel et al. (2019) detected particles with the MIDAS atomic
force microscope that were ≲10 μm in diameter and therefore at least a factor 2–3
smaller than those seen by COSISCOPE and more than an order of magnitude
smaller than seen by GIADA. Hence, particle sizes down to at least a ¼ 5 μm
were present in the coma.
Fig. 4.23 Left: GIADA measurements of mass and velocity for individual particles using the Grain
Detection System (a laser curtain) for the velocity and the Impact Sensor for the momentum.
Particles detected beyond and closer than r h ¼ 2.5 AU are shown as triangles and diamonds
respectively. Right: Histograms of the detected particle speeds. The solid line shows particles
detected at r h < 2.5 AU. The dashed line particles detected at r h > 2.5 AU
320
4 Dust Emission from the Surface
constant momentum and one can see the detection threshold clearly. However, the
histograms in Fig. 4.23 right show that one can use the data to investigate several
dependencies. In this example, particles seen inside a heliocentric distance of 2.5 AU
have a broader, faster velocity distribution when compared to particles seen beyond
2.5 AU which probably indicates the detection of newly produced particles leaving
the nucleus roughly radially. The narrower lower velocity distribution for particles
detected at r h > 2.5 AU may be older residuals (cf Della Corte et al. 2015). These
also have higher masses when looking at Fig. 4.23 left.
The SFD in the GIADA case cannot be described by a power law but appears
rather as a peaked distribution with a maximum at around 200–300 μm in radius
(depending upon the chosen density). This has led to significant controversy about
the size distribution and whether or not the inner coma dust size distribution can be
assumed to be solely made up of particles of this size. There is clearly inconsistency
between the GIADA result and the power law distributions derived from
COSISCOPE but there are obviously observational selection effects resulting from
the dynamic range of the instruments. As can be seen from Fig. 4.22 (left), the peak
optical scattering efficiency (radius ~ 1 μm) corresponds to a peak in the crosssectional area function derived from 1P/Halley measurements. There was no instrument on Rosetta capable of providing a size distribution for particles <30 μm in
diameter. However, Mannel et al. (2019) detected particles with the MIDAS atomic
force microscope that were ≲10 μm in diameter and therefore at least a factor 2–3
smaller than those seen by COSISCOPE and more than an order of magnitude
smaller than seen by GIADA. Hence, particle sizes down to at least a ¼ 5 μm
were present in the coma.
Fig. 4.23 Left: GIADA measurements of mass and velocity for individual particles using the Grain
Detection System (a laser curtain) for the velocity and the Impact Sensor for the momentum.
Particles detected beyond and closer than r h ¼ 2.5 AU are shown as triangles and diamonds
respectively. Right: Histograms of the detected particle speeds. The solid line shows particles
detected at r h < 2.5 AU. The dashed line particles detected at r h > 2.5 AU
320
4 Dust Emission from the Surface