

bin normalised to 600 km from the nucleus. Integration over the size distribution
then shows the importance of determining b d . It should, however, be remembered
that these data are for one comet and its applicability to other comets and at other
heliocentric distances is not given.
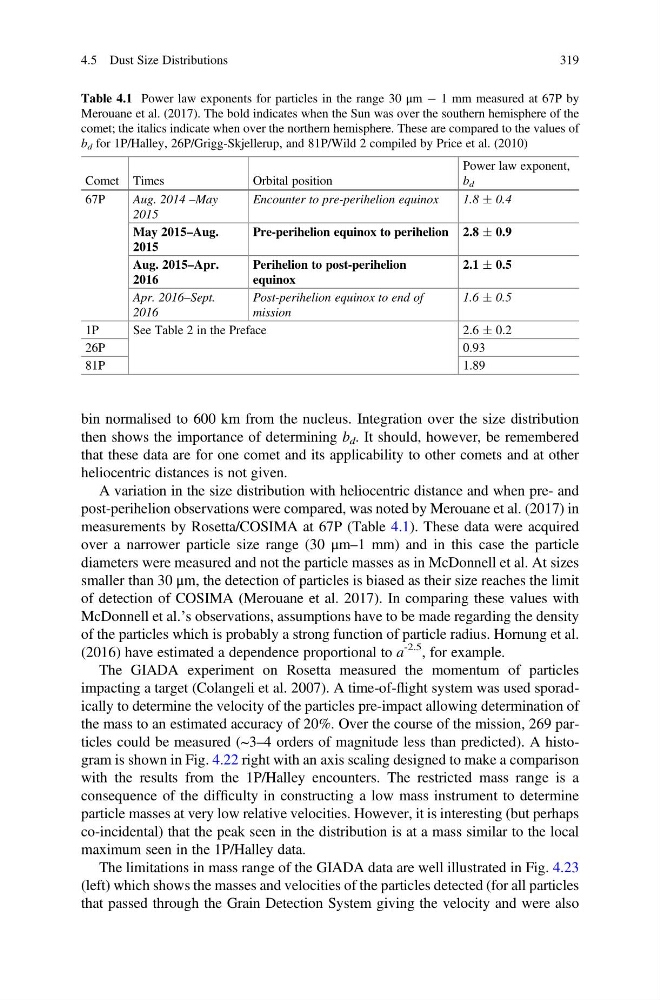
A variation in the size distribution with heliocentric distance and when pre- and
post-perihelion observations were compared, was noted by Merouane et al. (2017) in
measurements by Rosetta/COSIMA at 67P (Table 4.1). These data were acquired
over a narrower particle size range (30 μm–1 mm) and in this case the particle
diameters were measured and not the particle masses as in McDonnell et al. At sizes
smaller than 30 μm, the detection of particles is biased as their size reaches the limit
of detection of COSIMA (Merouane et al. 2017). In comparing these values with
McDonnell et al.’s observations, assumptions have to be made regarding the density
of the particles which is probably a strong function of particle radius. Hornung et al.
(2016) have estimated a dependence proportional to a
-2.5 , for example.
The GIADA experiment on Rosetta measured the momentum of particles
impacting a target (Colangeli et al. 2007). A time-of-flight system was used sporadically to determine the velocity of the particles pre-impact allowing determination of
the mass to an estimated accuracy of 20%. Over the course of the mission, 269 particles could be measured (~3–4 orders of magnitude less than predicted). A histogram is shown in Fig. 4.22 right with an axis scaling designed to make a comparison
with the results from the 1P/Halley encounters. The restricted mass range is a
consequence of the difficulty in constructing a low mass instrument to determine
particle masses at very low relative velocities. However, it is interesting (but perhaps
co-incidental) that the peak seen in the distribution is at a mass similar to the local
maximum seen in the 1P/Halley data.
The limitations in mass range of the GIADA data are well illustrated in Fig. 4.23
(left) which shows the masses and velocities of the particles detected (for all particles
that passed through the Grain Detection System giving the velocity and were also
Table 4.1 Power law exponents for particles in the range 30 μm À 1 mm measured at 67P by
Merouane et al. (2017). The bold indicates when the Sun was over the southern hemisphere of the
comet; the italics indicate when over the northern hemisphere. These are compared to the values of
b d for 1P/Halley, 26P/Grigg-Skjellerup, and 81P/Wild 2 compiled by Price et al. (2010)
Comet Times
Orbital position
Power law exponent,
b d
67P
Aug. 2014 –May
2015
Encounter to pre-perihelion equinox
1.8 Æ 0.4
May 2015–Aug.
2015
Pre-perihelion equinox to perihelion 2.8 Æ 0.9
Aug. 2015–Apr.
2016
Perihelion to post-perihelion
equinox
2.1 Æ 0.5
Apr. 2016–Sept.
2016
Post-perihelion equinox to end of
mission
1.6 Æ 0.5
1P
See Table 2 in the Preface
2.6 Æ 0.2
26P
0.93
81P
1.89
4.5 Dust Size Distributions
319
then shows the importance of determining b d . It should, however, be remembered
that these data are for one comet and its applicability to other comets and at other
heliocentric distances is not given.
A variation in the size distribution with heliocentric distance and when pre- and
post-perihelion observations were compared, was noted by Merouane et al. (2017) in
measurements by Rosetta/COSIMA at 67P (Table 4.1). These data were acquired
over a narrower particle size range (30 μm–1 mm) and in this case the particle
diameters were measured and not the particle masses as in McDonnell et al. At sizes
smaller than 30 μm, the detection of particles is biased as their size reaches the limit
of detection of COSIMA (Merouane et al. 2017). In comparing these values with
McDonnell et al.’s observations, assumptions have to be made regarding the density
of the particles which is probably a strong function of particle radius. Hornung et al.
(2016) have estimated a dependence proportional to a
-2.5 , for example.
The GIADA experiment on Rosetta measured the momentum of particles
impacting a target (Colangeli et al. 2007). A time-of-flight system was used sporadically to determine the velocity of the particles pre-impact allowing determination of
the mass to an estimated accuracy of 20%. Over the course of the mission, 269 particles could be measured (~3–4 orders of magnitude less than predicted). A histogram is shown in Fig. 4.22 right with an axis scaling designed to make a comparison
with the results from the 1P/Halley encounters. The restricted mass range is a
consequence of the difficulty in constructing a low mass instrument to determine
particle masses at very low relative velocities. However, it is interesting (but perhaps
co-incidental) that the peak seen in the distribution is at a mass similar to the local
maximum seen in the 1P/Halley data.
The limitations in mass range of the GIADA data are well illustrated in Fig. 4.23
(left) which shows the masses and velocities of the particles detected (for all particles
that passed through the Grain Detection System giving the velocity and were also
Table 4.1 Power law exponents for particles in the range 30 μm À 1 mm measured at 67P by
Merouane et al. (2017). The bold indicates when the Sun was over the southern hemisphere of the
comet; the italics indicate when over the northern hemisphere. These are compared to the values of
b d for 1P/Halley, 26P/Grigg-Skjellerup, and 81P/Wild 2 compiled by Price et al. (2010)
Comet Times
Orbital position
Power law exponent,
b d
67P
Aug. 2014 –May
2015
Encounter to pre-perihelion equinox
1.8 Æ 0.4
May 2015–Aug.
2015
Pre-perihelion equinox to perihelion 2.8 Æ 0.9
Aug. 2015–Apr.
2016
Perihelion to post-perihelion
equinox
2.1 Æ 0.5
Apr. 2016–Sept.
2016
Post-perihelion equinox to end of
mission
1.6 Æ 0.5
1P
See Table 2 in the Preface
2.6 Æ 0.2
26P
0.93
81P
1.89
4.5 Dust Size Distributions
319