

A particle emitted from the nucleus in the sunward direction and rapidly accelerated to a velocity, v d0 , along the Sun-comet line will reach a maximum distance,
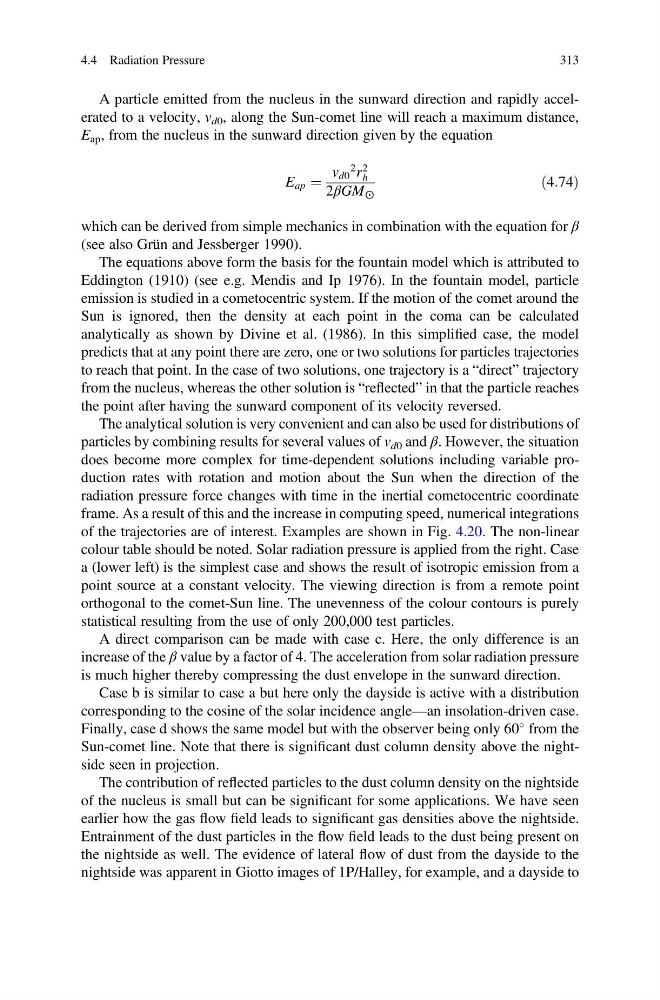
E ap , from the nucleus in the sunward direction given by the equation
E ap ¼
v d0
2 r
2
h
2βGM ⨀
ð4:74Þ
which can be derived from simple mechanics in combination with the equation for β
(see also Grün and Jessberger 1990).
The equations above form the basis for the fountain model which is attributed to
Eddington (1910) (see e.g. Mendis and Ip 1976). In the fountain model, particle
emission is studied in a cometocentric system. If the motion of the comet around the
Sun is ignored, then the density at each point in the coma can be calculated
analytically as shown by Divine et al. (1986). In this simplified case, the model
predicts that at any point there are zero, one or two solutions for particles trajectories
to reach that point. In the case of two solutions, one trajectory is a “direct” trajectory
from the nucleus, whereas the other solution is “reflected” in that the particle reaches
the point after having the sunward component of its velocity reversed.
The analytical solution is very convenient and can also be used for distributions of
particles by combining results for several values of v d0 and β. However, the situation
does become more complex for time-dependent solutions including variable production rates with rotation and motion about the Sun when the direction of the
radiation pressure force changes with time in the inertial cometocentric coordinate
frame. As a result of this and the increase in computing speed, numerical integrations
of the trajectories are of interest. Examples are shown in Fig. 4.20. The non-linear
colour table should be noted. Solar radiation pressure is applied from the right. Case
a (lower left) is the simplest case and shows the result of isotropic emission from a
point source at a constant velocity. The viewing direction is from a remote point
orthogonal to the comet-Sun line. The unevenness of the colour contours is purely
statistical resulting from the use of only 200,000 test particles.
A direct comparison can be made with case c. Here, the only difference is an
increase of the β value by a factor of 4. The acceleration from solar radiation pressure
is much higher thereby compressing the dust envelope in the sunward direction.
Case b is similar to case a but here only the dayside is active with a distribution
corresponding to the cosine of the solar incidence angle—an insolation-driven case.
Finally, case d shows the same model but with the observer being only 60
from the
Sun-comet line. Note that there is significant dust column density above the nightside seen in projection.
The contribution of reflected particles to the dust column density on the nightside
of the nucleus is small but can be significant for some applications. We have seen
earlier how the gas flow field leads to significant gas densities above the nightside.
Entrainment of the dust particles in the flow field leads to the dust being present on
the nightside as well. The evidence of lateral flow of dust from the dayside to the
nightside was apparent in Giotto images of 1P/Halley, for example, and a dayside to
4.4 Radiation Pressure
313
E ap , from the nucleus in the sunward direction given by the equation
E ap ¼
v d0
2 r
2
h
2βGM ⨀
ð4:74Þ
which can be derived from simple mechanics in combination with the equation for β
(see also Grün and Jessberger 1990).
The equations above form the basis for the fountain model which is attributed to
Eddington (1910) (see e.g. Mendis and Ip 1976). In the fountain model, particle
emission is studied in a cometocentric system. If the motion of the comet around the
Sun is ignored, then the density at each point in the coma can be calculated
analytically as shown by Divine et al. (1986). In this simplified case, the model
predicts that at any point there are zero, one or two solutions for particles trajectories
to reach that point. In the case of two solutions, one trajectory is a “direct” trajectory
from the nucleus, whereas the other solution is “reflected” in that the particle reaches
the point after having the sunward component of its velocity reversed.
The analytical solution is very convenient and can also be used for distributions of
particles by combining results for several values of v d0 and β. However, the situation
does become more complex for time-dependent solutions including variable production rates with rotation and motion about the Sun when the direction of the
radiation pressure force changes with time in the inertial cometocentric coordinate
frame. As a result of this and the increase in computing speed, numerical integrations
of the trajectories are of interest. Examples are shown in Fig. 4.20. The non-linear
colour table should be noted. Solar radiation pressure is applied from the right. Case
a (lower left) is the simplest case and shows the result of isotropic emission from a
point source at a constant velocity. The viewing direction is from a remote point
orthogonal to the comet-Sun line. The unevenness of the colour contours is purely
statistical resulting from the use of only 200,000 test particles.
A direct comparison can be made with case c. Here, the only difference is an
increase of the β value by a factor of 4. The acceleration from solar radiation pressure
is much higher thereby compressing the dust envelope in the sunward direction.
Case b is similar to case a but here only the dayside is active with a distribution
corresponding to the cosine of the solar incidence angle—an insolation-driven case.
Finally, case d shows the same model but with the observer being only 60
from the
Sun-comet line. Note that there is significant dust column density above the nightside seen in projection.
The contribution of reflected particles to the dust column density on the nightside
of the nucleus is small but can be significant for some applications. We have seen
earlier how the gas flow field leads to significant gas densities above the nightside.
Entrainment of the dust particles in the flow field leads to the dust being present on
the nightside as well. The evidence of lateral flow of dust from the dayside to the
nightside was apparent in Giotto images of 1P/Halley, for example, and a dayside to
4.4 Radiation Pressure
313