

allowing direct comparison of OH and H 2 O in the inner coma. Prompt emission from
OH* should trace the H 2 O spatial distribution unless optical depth effects are
important.
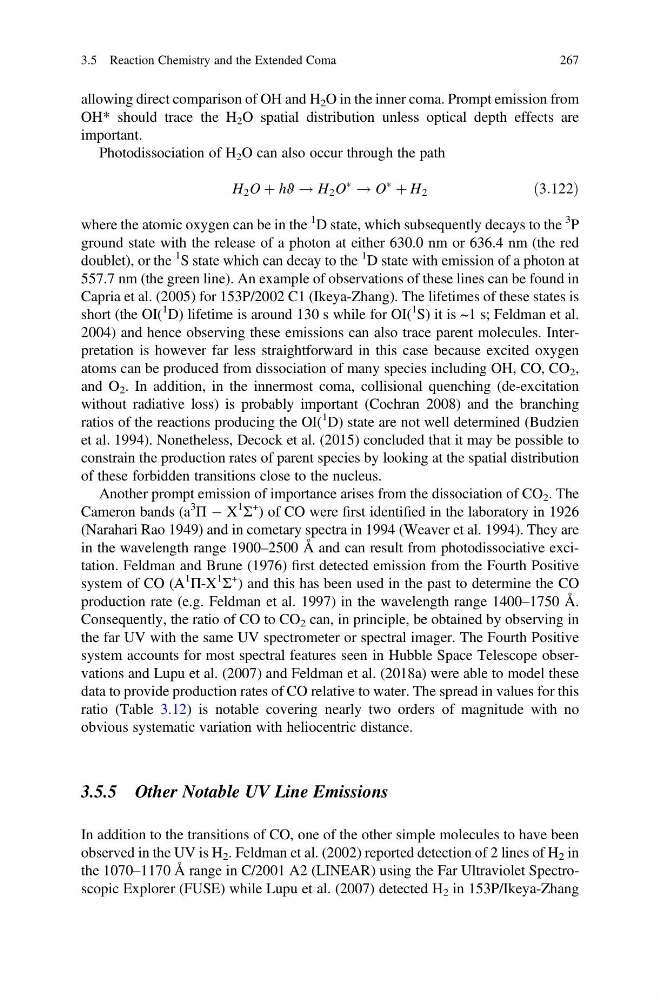
Photodissociation of H 2 O can also occur through the path
H 2 O þ hϑ ! H 2 O
Ã
! O
Ã
þ H 2
ð3:122Þ
where the atomic oxygen can be in the
1 D state, which subsequently decays to the
3 P
ground state with the release of a photon at either 630.0 nm or 636.4 nm (the red
doublet), or the
1 S state which can decay to the
1 D state with emission of a photon at
557.7 nm (the green line). An example of observations of these lines can be found in
Capria et al. (2005) for 153P/2002 C1 (Ikeya-Zhang). The lifetimes of these states is
short (the OI(
1 D) lifetime is around 130 s while for OI(
1 S) it is ~1 s; Feldman et al.
2004) and hence observing these emissions can also trace parent molecules. Interpretation is however far less straightforward in this case because excited oxygen
atoms can be produced from dissociation of many species including OH, CO, CO 2 ,
and O 2 . In addition, in the innermost coma, collisional quenching (de-excitation
without radiative loss) is probably important (Cochran 2008) and the branching
ratios of the reactions producing the OI(
1 D) state are not well determined (Budzien
et al. 1994). Nonetheless, Decock et al. (2015) concluded that it may be possible to
constrain the production rates of parent species by looking at the spatial distribution
of these forbidden transitions close to the nucleus.
Another prompt emission of importance arises from the dissociation of CO 2 . The
Cameron bands (a
3
Π À X
1
Σ
+
) of CO were first identified in the laboratory in 1926
(Narahari Rao 1949) and in cometary spectra in 1994 (Weaver et al. 1994). They are
in the wavelength range 1900–2500 Å and can result from photodissociative excitation. Feldman and Brune (1976) first detected emission from the Fourth Positive
system of CO (A
1
Π-X
1
Σ
+
) and this has been used in the past to determine the CO
production rate (e.g. Feldman et al. 1997) in the wavelength range 1400–1750 Å.
Consequently, the ratio of CO to CO 2 can, in principle, be obtained by observing in
the far UV with the same UV spectrometer or spectral imager. The Fourth Positive
system accounts for most spectral features seen in Hubble Space Telescope observations and Lupu et al. (2007) and Feldman et al. (2018a) were able to model these
data to provide production rates of CO relative to water. The spread in values for this
ratio (Table 3.12) is notable covering nearly two orders of magnitude with no
obvious systematic variation with heliocentric distance.
3.5.5 Other Notable UV Line Emissions
In addition to the transitions of CO, one of the other simple molecules to have been
observed in the UV is H 2 . Feldman et al. (2002) reported detection of 2 lines of H 2 in
the 1070–1170 Å range in C/2001 A2 (LINEAR) using the Far Ultraviolet Spectroscopic Explorer (FUSE) while Lupu et al. (2007) detected H 2 in 153P/Ikeya-Zhang
3.5 Reaction Chemistry and the Extended Coma
267
OH* should trace the H 2 O spatial distribution unless optical depth effects are
important.
Photodissociation of H 2 O can also occur through the path
H 2 O þ hϑ ! H 2 O
Ã
! O
Ã
þ H 2
ð3:122Þ
where the atomic oxygen can be in the
1 D state, which subsequently decays to the
3 P
ground state with the release of a photon at either 630.0 nm or 636.4 nm (the red
doublet), or the
1 S state which can decay to the
1 D state with emission of a photon at
557.7 nm (the green line). An example of observations of these lines can be found in
Capria et al. (2005) for 153P/2002 C1 (Ikeya-Zhang). The lifetimes of these states is
short (the OI(
1 D) lifetime is around 130 s while for OI(
1 S) it is ~1 s; Feldman et al.
2004) and hence observing these emissions can also trace parent molecules. Interpretation is however far less straightforward in this case because excited oxygen
atoms can be produced from dissociation of many species including OH, CO, CO 2 ,
and O 2 . In addition, in the innermost coma, collisional quenching (de-excitation
without radiative loss) is probably important (Cochran 2008) and the branching
ratios of the reactions producing the OI(
1 D) state are not well determined (Budzien
et al. 1994). Nonetheless, Decock et al. (2015) concluded that it may be possible to
constrain the production rates of parent species by looking at the spatial distribution
of these forbidden transitions close to the nucleus.
Another prompt emission of importance arises from the dissociation of CO 2 . The
Cameron bands (a
3
Π À X
1
Σ
+
) of CO were first identified in the laboratory in 1926
(Narahari Rao 1949) and in cometary spectra in 1994 (Weaver et al. 1994). They are
in the wavelength range 1900–2500 Å and can result from photodissociative excitation. Feldman and Brune (1976) first detected emission from the Fourth Positive
system of CO (A
1
Π-X
1
Σ
+
) and this has been used in the past to determine the CO
production rate (e.g. Feldman et al. 1997) in the wavelength range 1400–1750 Å.
Consequently, the ratio of CO to CO 2 can, in principle, be obtained by observing in
the far UV with the same UV spectrometer or spectral imager. The Fourth Positive
system accounts for most spectral features seen in Hubble Space Telescope observations and Lupu et al. (2007) and Feldman et al. (2018a) were able to model these
data to provide production rates of CO relative to water. The spread in values for this
ratio (Table 3.12) is notable covering nearly two orders of magnitude with no
obvious systematic variation with heliocentric distance.
3.5.5 Other Notable UV Line Emissions
In addition to the transitions of CO, one of the other simple molecules to have been
observed in the UV is H 2 . Feldman et al. (2002) reported detection of 2 lines of H 2 in
the 1070–1170 Å range in C/2001 A2 (LINEAR) using the Far Ultraviolet Spectroscopic Explorer (FUSE) while Lupu et al. (2007) detected H 2 in 153P/Ikeya-Zhang
3.5 Reaction Chemistry and the Extended Coma
267