

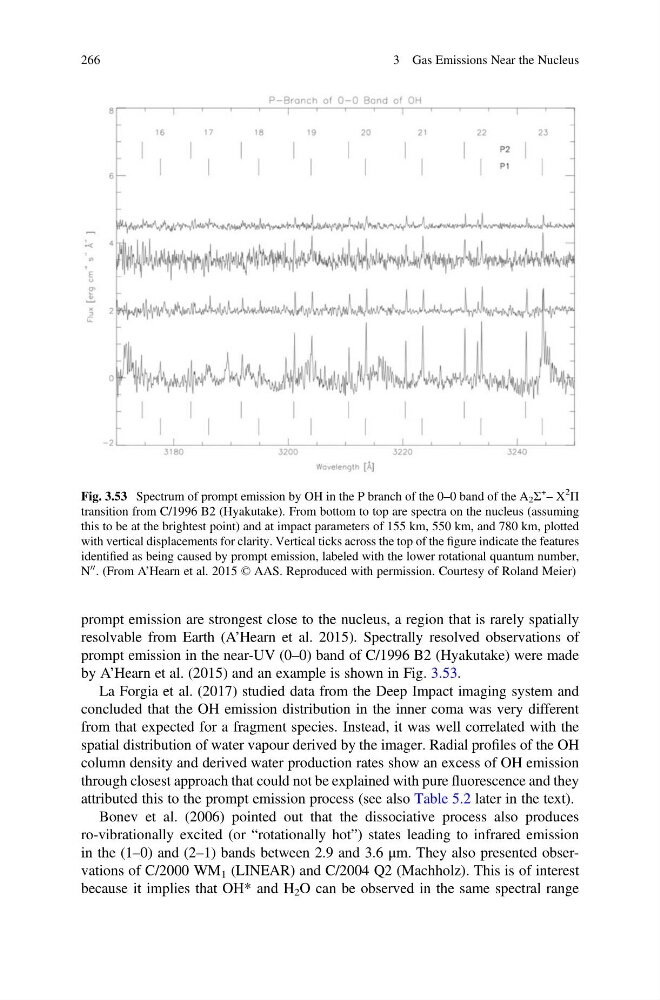
prompt emission are strongest close to the nucleus, a region that is rarely spatially
resolvable from Earth (A’Hearn et al. 2015). Spectrally resolved observations of
prompt emission in the near-UV (0–0) band of C/1996 B2 (Hyakutake) were made
by A’Hearn et al. (2015) and an example is shown in Fig. 3.53.
La Forgia et al. (2017) studied data from the Deep Impact imaging system and
concluded that the OH emission distribution in the inner coma was very different
from that expected for a fragment species. Instead, it was well correlated with the
spatial distribution of water vapour derived by the imager. Radial profiles of the OH
column density and derived water production rates show an excess of OH emission
through closest approach that could not be explained with pure fluorescence and they
attributed this to the prompt emission process (see also Table 5.2 later in the text).
Bonev et al. (2006) pointed out that the dissociative process also produces
ro-vibrationally excited (or “rotationally hot”) states leading to infrared emission
in the (1–0) and (2–1) bands between 2.9 and 3.6 μm. They also presented observations of C/2000 WM 1 (LINEAR) and C/2004 Q2 (Machholz). This is of interest
because it implies that OH* and H 2 O can be observed in the same spectral range
Fig. 3.53 Spectrum of prompt emission by OH in the P branch of the 0–0 band of the A 2 Σ
+ – X
2
Π
transition from C/1996 B2 (Hyakutake). From bottom to top are spectra on the nucleus (assuming
this to be at the brightest point) and at impact parameters of 155 km, 550 km, and 780 km, plotted
with vertical displacements for clarity. Vertical ticks across the top of the figure indicate the features
identified as being caused by prompt emission, labeled with the lower rotational quantum number,
N
00 . (From A’Hearn et al. 2015 © AAS. Reproduced with permission. Courtesy of Roland Meier)
266
3 Gas Emissions Near the Nucleus
resolvable from Earth (A’Hearn et al. 2015). Spectrally resolved observations of
prompt emission in the near-UV (0–0) band of C/1996 B2 (Hyakutake) were made
by A’Hearn et al. (2015) and an example is shown in Fig. 3.53.
La Forgia et al. (2017) studied data from the Deep Impact imaging system and
concluded that the OH emission distribution in the inner coma was very different
from that expected for a fragment species. Instead, it was well correlated with the
spatial distribution of water vapour derived by the imager. Radial profiles of the OH
column density and derived water production rates show an excess of OH emission
through closest approach that could not be explained with pure fluorescence and they
attributed this to the prompt emission process (see also Table 5.2 later in the text).
Bonev et al. (2006) pointed out that the dissociative process also produces
ro-vibrationally excited (or “rotationally hot”) states leading to infrared emission
in the (1–0) and (2–1) bands between 2.9 and 3.6 μm. They also presented observations of C/2000 WM 1 (LINEAR) and C/2004 Q2 (Machholz). This is of interest
because it implies that OH* and H 2 O can be observed in the same spectral range
Fig. 3.53 Spectrum of prompt emission by OH in the P branch of the 0–0 band of the A 2 Σ
+ – X
2
Π
transition from C/1996 B2 (Hyakutake). From bottom to top are spectra on the nucleus (assuming
this to be at the brightest point) and at impact parameters of 155 km, 550 km, and 780 km, plotted
with vertical displacements for clarity. Vertical ticks across the top of the figure indicate the features
identified as being caused by prompt emission, labeled with the lower rotational quantum number,
N
00 . (From A’Hearn et al. 2015 © AAS. Reproduced with permission. Courtesy of Roland Meier)
266
3 Gas Emissions Near the Nucleus