

essentially independent of each other and respond to individually applied forces and
reaction chemistry (e.g. photo-dissociation).
The origin of the gas is sublimation from the nucleus and molecules emitted from
the surface have velocity vectors with components directed away from the nucleus.
(The subliming gas cannot have a velocity component in a direction towards the
nucleus otherwise it would not leave the surface). The VDF is therefore
non-Maxwellian. The exact form of the velocity distribution is not known but a
half-Maxwellian can be assumed as an approximation. This is obviously not in
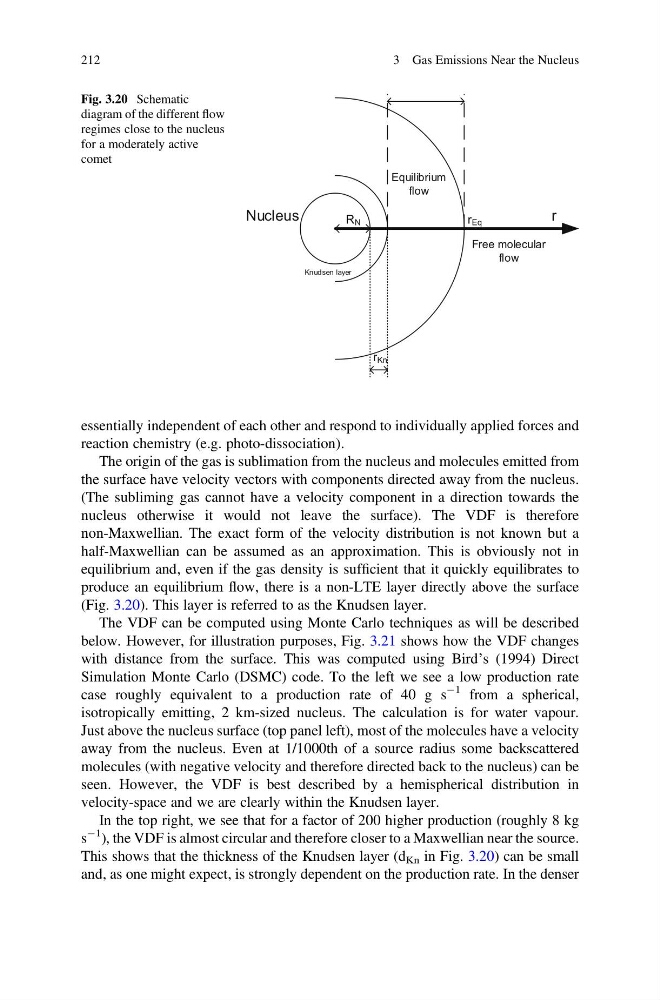
equilibrium and, even if the gas density is sufficient that it quickly equilibrates to
produce an equilibrium flow, there is a non-LTE layer directly above the surface
(Fig. 3.20). This layer is referred to as the Knudsen layer.
The VDF can be computed using Monte Carlo techniques as will be described
below. However, for illustration purposes, Fig. 3.21 shows how the VDF changes
with distance from the surface. This was computed using Bird’s (1994) Direct
Simulation Monte Carlo (DSMC) code. To the left we see a low production rate
case roughly equivalent to a production rate of 40 g s
À1 from a spherical,
isotropically emitting, 2 km-sized nucleus. The calculation is for water vapour.
Just above the nucleus surface (top panel left), most of the molecules have a velocity
away from the nucleus. Even at 1/1000th of a source radius some backscattered
molecules (with negative velocity and therefore directed back to the nucleus) can be
seen. However, the VDF is best described by a hemispherical distribution in
velocity-space and we are clearly within the Knudsen layer.
In the top right, we see that for a factor of 200 higher production (roughly 8 kg
s
À1 ), the VDF is almost circular and therefore closer to a Maxwellian near the source.
This shows that the thickness of the Knudsen layer (d Kn in Fig. 3.20) can be small
and, as one might expect, is strongly dependent on the production rate. In the denser
Nucleus
r
Equilibrium
flow
Free molecular
flow
Knudsen layer
r Kn
r Eq
R N
Fig. 3.20 Schematic
diagram of the different flow
regimes close to the nucleus
for a moderately active
comet
212
3 Gas Emissions Near the Nucleus
reaction chemistry (e.g. photo-dissociation).
The origin of the gas is sublimation from the nucleus and molecules emitted from
the surface have velocity vectors with components directed away from the nucleus.
(The subliming gas cannot have a velocity component in a direction towards the
nucleus otherwise it would not leave the surface). The VDF is therefore
non-Maxwellian. The exact form of the velocity distribution is not known but a
half-Maxwellian can be assumed as an approximation. This is obviously not in
equilibrium and, even if the gas density is sufficient that it quickly equilibrates to
produce an equilibrium flow, there is a non-LTE layer directly above the surface
(Fig. 3.20). This layer is referred to as the Knudsen layer.
The VDF can be computed using Monte Carlo techniques as will be described
below. However, for illustration purposes, Fig. 3.21 shows how the VDF changes
with distance from the surface. This was computed using Bird’s (1994) Direct
Simulation Monte Carlo (DSMC) code. To the left we see a low production rate
case roughly equivalent to a production rate of 40 g s
À1 from a spherical,
isotropically emitting, 2 km-sized nucleus. The calculation is for water vapour.
Just above the nucleus surface (top panel left), most of the molecules have a velocity
away from the nucleus. Even at 1/1000th of a source radius some backscattered
molecules (with negative velocity and therefore directed back to the nucleus) can be
seen. However, the VDF is best described by a hemispherical distribution in
velocity-space and we are clearly within the Knudsen layer.
In the top right, we see that for a factor of 200 higher production (roughly 8 kg
s
À1 ), the VDF is almost circular and therefore closer to a Maxwellian near the source.
This shows that the thickness of the Knudsen layer (d Kn in Fig. 3.20) can be small
and, as one might expect, is strongly dependent on the production rate. In the denser
Nucleus
r
Equilibrium
flow
Free molecular
flow
Knudsen layer
r Kn
r Eq
R N
Fig. 3.20 Schematic
diagram of the different flow
regimes close to the nucleus
for a moderately active
comet
212
3 Gas Emissions Near the Nucleus