

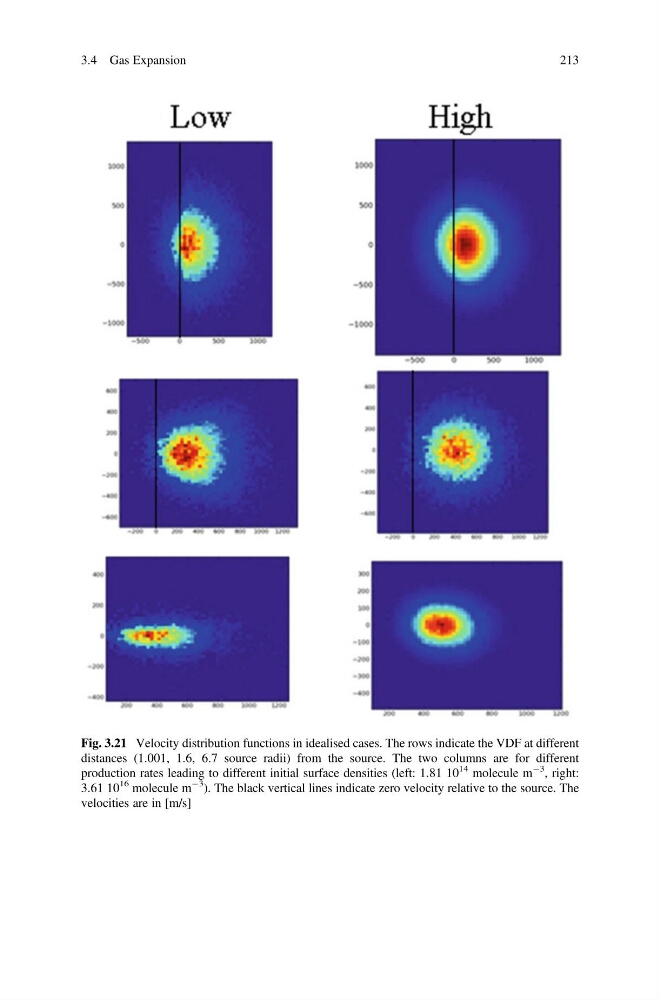
Fig. 3.21 Velocity distribution functions in idealised cases. The rows indicate the VDF at different
distances (1.001, 1.6, 6.7 source radii) from the source. The two columns are for different
production rates leading to different initial surface densities (left: 1.81 10
14 molecule m
À3
, right:
3.61 10
16 molecule m
À3
). The black vertical lines indicate zero velocity relative to the source. The
velocities are in [m/s]
3.4 Gas Expansion
213
distances (1.001, 1.6, 6.7 source radii) from the source. The two columns are for different
production rates leading to different initial surface densities (left: 1.81 10
14 molecule m
À3
, right:
3.61 10
16 molecule m
À3
). The black vertical lines indicate zero velocity relative to the source. The
velocities are in [m/s]
3.4 Gas Expansion
213