

excitation mechanism is resonance fluorescence). As a result of the combination of
emissions and absorptions, line profiles in a non-isothermal system can become
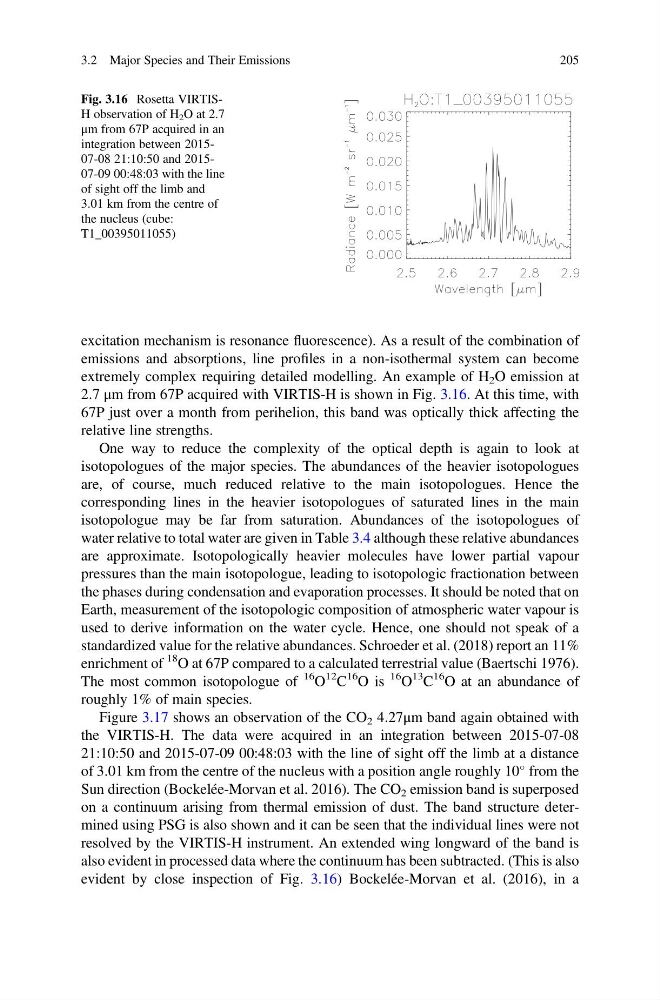
extremely complex requiring detailed modelling. An example of H 2 O emission at
2.7 μm from 67P acquired with VIRTIS-H is shown in Fig. 3.16. At this time, with
67P just over a month from perihelion, this band was optically thick affecting the
relative line strengths.
One way to reduce the complexity of the optical depth is again to look at
isotopologues of the major species. The abundances of the heavier isotopologues
are, of course, much reduced relative to the main isotopologues. Hence the
corresponding lines in the heavier isotopologues of saturated lines in the main
isotopologue may be far from saturation. Abundances of the isotopologues of
water relative to total water are given in Table 3.4 although these relative abundances
are approximate. Isotopologically heavier molecules have lower partial vapour
pressures than the main isotopologue, leading to isotopologic fractionation between
the phases during condensation and evaporation processes. It should be noted that on
Earth, measurement of the isotopologic composition of atmospheric water vapour is
used to derive information on the water cycle. Hence, one should not speak of a
standardized value for the relative abundances. Schroeder et al. (2018) report an 11%
enrichment of
18 O at 67P compared to a calculated terrestrial value (Baertschi 1976).
The most common isotopologue of
16 O
12 C
16
O is
16 O
13 C
16 O at an abundance of
roughly 1% of main species.
Figure 3.17 shows an observation of the CO 2 4.27μm band again obtained with
the VIRTIS-H. The data were acquired in an integration between 2015-07-08
21:10:50 and 2015-07-09 00:48:03 with the line of sight off the limb at a distance
of 3.01 km from the centre of the nucleus with a position angle roughly 10
from the
Sun direction (Bockelée-Morvan et al. 2016). The CO 2 emission band is superposed
on a continuum arising from thermal emission of dust. The band structure determined using PSG is also shown and it can be seen that the individual lines were not
resolved by the VIRTIS-H instrument. An extended wing longward of the band is
also evident in processed data where the continuum has been subtracted. (This is also
evident by close inspection of Fig. 3.16) Bockelée-Morvan et al. (2016), in a
Fig. 3.16 Rosetta VIRTISH observation of H 2 O at 2.7
μm from 67P acquired in an
integration between 201507-08 21:10:50 and 201507-09 00:48:03 with the line
of sight off the limb and
3.01 km from the centre of
the nucleus (cube:
T1_00395011055)
3.2 Major Species and Their Emissions
205
emissions and absorptions, line profiles in a non-isothermal system can become
extremely complex requiring detailed modelling. An example of H 2 O emission at
2.7 μm from 67P acquired with VIRTIS-H is shown in Fig. 3.16. At this time, with
67P just over a month from perihelion, this band was optically thick affecting the
relative line strengths.
One way to reduce the complexity of the optical depth is again to look at
isotopologues of the major species. The abundances of the heavier isotopologues
are, of course, much reduced relative to the main isotopologues. Hence the
corresponding lines in the heavier isotopologues of saturated lines in the main
isotopologue may be far from saturation. Abundances of the isotopologues of
water relative to total water are given in Table 3.4 although these relative abundances
are approximate. Isotopologically heavier molecules have lower partial vapour
pressures than the main isotopologue, leading to isotopologic fractionation between
the phases during condensation and evaporation processes. It should be noted that on
Earth, measurement of the isotopologic composition of atmospheric water vapour is
used to derive information on the water cycle. Hence, one should not speak of a
standardized value for the relative abundances. Schroeder et al. (2018) report an 11%
enrichment of
18 O at 67P compared to a calculated terrestrial value (Baertschi 1976).
The most common isotopologue of
16 O
12 C
16
O is
16 O
13 C
16 O at an abundance of
roughly 1% of main species.
Figure 3.17 shows an observation of the CO 2 4.27μm band again obtained with
the VIRTIS-H. The data were acquired in an integration between 2015-07-08
21:10:50 and 2015-07-09 00:48:03 with the line of sight off the limb at a distance
of 3.01 km from the centre of the nucleus with a position angle roughly 10
from the
Sun direction (Bockelée-Morvan et al. 2016). The CO 2 emission band is superposed
on a continuum arising from thermal emission of dust. The band structure determined using PSG is also shown and it can be seen that the individual lines were not
resolved by the VIRTIS-H instrument. An extended wing longward of the band is
also evident in processed data where the continuum has been subtracted. (This is also
evident by close inspection of Fig. 3.16) Bockelée-Morvan et al. (2016), in a
Fig. 3.16 Rosetta VIRTISH observation of H 2 O at 2.7
μm from 67P acquired in an
integration between 201507-08 21:10:50 and 201507-09 00:48:03 with the line
of sight off the limb and
3.01 km from the centre of
the nucleus (cube:
T1_00395011055)
3.2 Major Species and Their Emissions
205