

take values of Æ1, Æ2, Æ3, etc. Transitions between vibrational levels are not
constrained because there are no strict selection rules. A vibrational transition between
two states is called a band and the precise transition in a molecule is denoted as (v q
0 ,
v q
00 ) where v q
0 and v q
00 are the quantum numbers of the upper and lower states
respectively. Each vibrational band can be further split into rotational levels.
Transitions involving changes in both vibrational and rotational states are referred
to as ro-vibrational transitions. Here, however, selection rules apply. In linear
molecules such as CO (and CO 2 ), the rotational lines are found as simple progressions at higher and lower frequencies relative to the pure vibrational frequencies.
The energy change resulting from the change in rotational state can be either
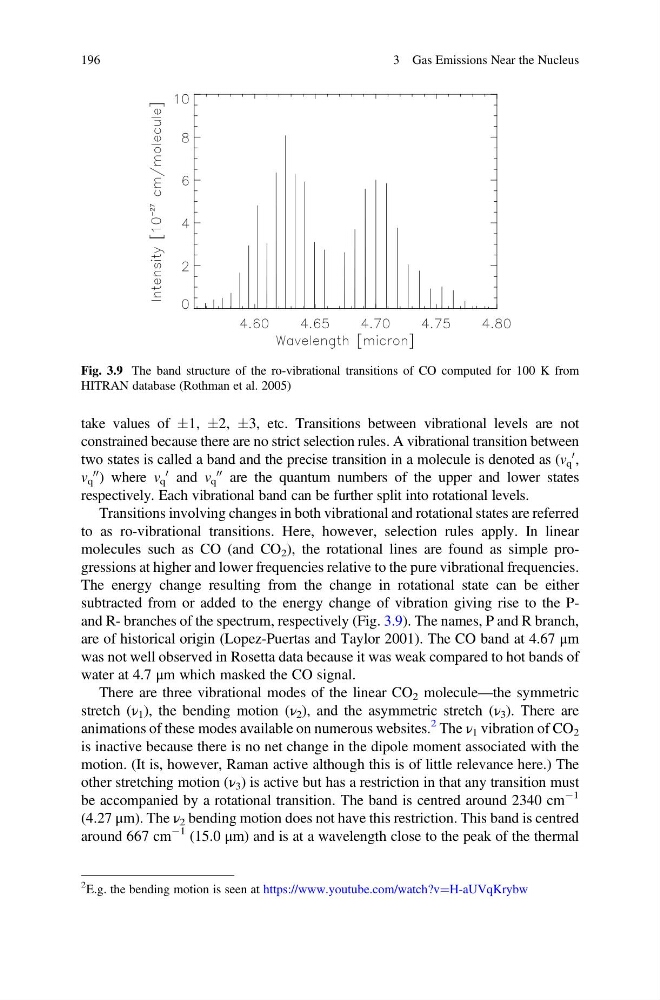
subtracted from or added to the energy change of vibration giving rise to the Pand R- branches of the spectrum, respectively (Fig. 3.9). The names, P and R branch,
are of historical origin (Lopez-Puertas and Taylor 2001). The CO band at 4.67 μm
was not well observed in Rosetta data because it was weak compared to hot bands of
water at 4.7 μm which masked the CO signal.
There are three vibrational modes of the linear CO 2 molecule—the symmetric
stretch (ν 1 ), the bending motion (ν 2 ), and the asymmetric stretch (ν 3 ). There are
animations of these modes available on numerous websites.
2 The ν 1 vibration of CO 2
is inactive because there is no net change in the dipole moment associated with the
motion. (It is, however, Raman active although this is of little relevance here.) The
other stretching motion (ν 3 ) is active but has a restriction in that any transition must
be accompanied by a rotational transition. The band is centred around 2340 cm
À1
(4.27 μm). The ν 2 bending motion does not have this restriction. This band is centred
around 667 cm
À1 (15.0 μm) and is at a wavelength close to the peak of the thermal
Fig. 3.9 The band structure of the ro-vibrational transitions of CO computed for 100 K from
HITRAN database (Rothman et al. 2005)
2 E.g. the bending motion is seen at https://www.youtube.com/watch?v¼H-aUVqKrybw
196
3 Gas Emissions Near the Nucleus
constrained because there are no strict selection rules. A vibrational transition between
two states is called a band and the precise transition in a molecule is denoted as (v q
0 ,
v q
00 ) where v q
0 and v q
00 are the quantum numbers of the upper and lower states
respectively. Each vibrational band can be further split into rotational levels.
Transitions involving changes in both vibrational and rotational states are referred
to as ro-vibrational transitions. Here, however, selection rules apply. In linear
molecules such as CO (and CO 2 ), the rotational lines are found as simple progressions at higher and lower frequencies relative to the pure vibrational frequencies.
The energy change resulting from the change in rotational state can be either
subtracted from or added to the energy change of vibration giving rise to the Pand R- branches of the spectrum, respectively (Fig. 3.9). The names, P and R branch,
are of historical origin (Lopez-Puertas and Taylor 2001). The CO band at 4.67 μm
was not well observed in Rosetta data because it was weak compared to hot bands of
water at 4.7 μm which masked the CO signal.
There are three vibrational modes of the linear CO 2 molecule—the symmetric
stretch (ν 1 ), the bending motion (ν 2 ), and the asymmetric stretch (ν 3 ). There are
animations of these modes available on numerous websites.
2 The ν 1 vibration of CO 2
is inactive because there is no net change in the dipole moment associated with the
motion. (It is, however, Raman active although this is of little relevance here.) The
other stretching motion (ν 3 ) is active but has a restriction in that any transition must
be accompanied by a rotational transition. The band is centred around 2340 cm
À1
(4.27 μm). The ν 2 bending motion does not have this restriction. This band is centred
around 667 cm
À1 (15.0 μm) and is at a wavelength close to the peak of the thermal
Fig. 3.9 The band structure of the ro-vibrational transitions of CO computed for 100 K from
HITRAN database (Rothman et al. 2005)
2 E.g. the bending motion is seen at https://www.youtube.com/watch?v¼H-aUVqKrybw
196
3 Gas Emissions Near the Nucleus