

E ¼ v q þ
1
2
v v À v q þ
1
2
2
v v Χ
ð3:35Þ
where v q is the vibrational quantum number, v v is the harmonic wavenumber and Χ
is an anharmonicity constant (e.g. Lopez-Puertas and Taylor 2001). Transitions that
are forbidden according to a harmonic oscillator model do occur because of the
non-linearities and thus the vibrational spectrum becomes more complex as Δv q can
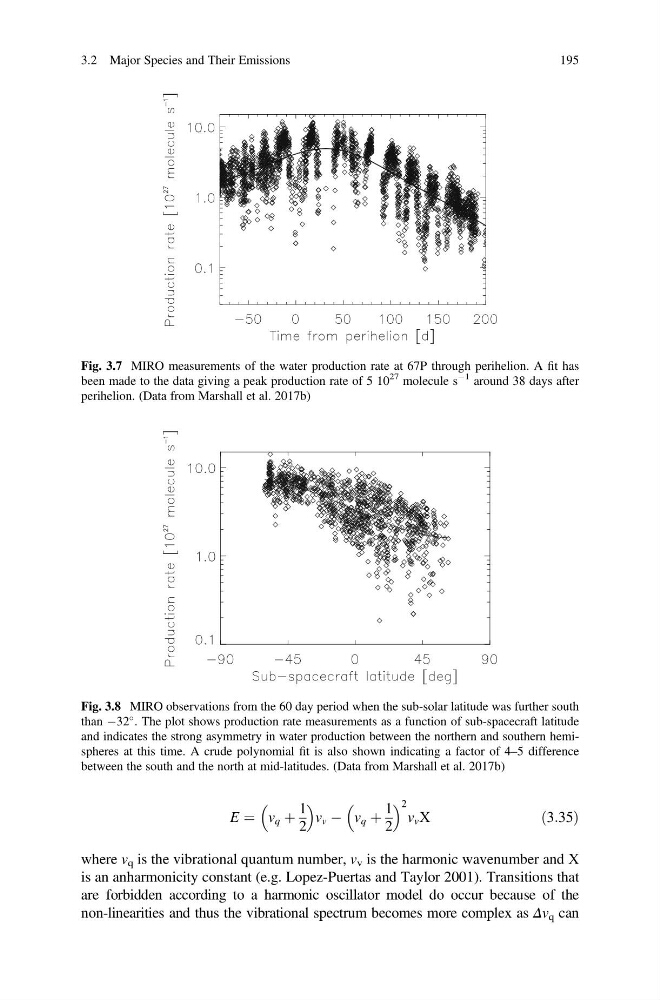
Fig. 3.7 MIRO measurements of the water production rate at 67P through perihelion. A fit has
been made to the data giving a peak production rate of 5 10
27 molecule s
À1 around 38 days after
perihelion. (Data from Marshall et al. 2017b)
Fig. 3.8 MIRO observations from the 60 day period when the sub-solar latitude was further south
than À32
. The plot shows production rate measurements as a function of sub-spacecraft latitude
and indicates the strong asymmetry in water production between the northern and southern hemispheres at this time. A crude polynomial fit is also shown indicating a factor of 4–5 difference
between the south and the north at mid-latitudes. (Data from Marshall et al. 2017b)
3.2 Major Species and Their Emissions
195
1
2
v v À v q þ
1
2
2
v v Χ
ð3:35Þ
where v q is the vibrational quantum number, v v is the harmonic wavenumber and Χ
is an anharmonicity constant (e.g. Lopez-Puertas and Taylor 2001). Transitions that
are forbidden according to a harmonic oscillator model do occur because of the
non-linearities and thus the vibrational spectrum becomes more complex as Δv q can
Fig. 3.7 MIRO measurements of the water production rate at 67P through perihelion. A fit has
been made to the data giving a peak production rate of 5 10
27 molecule s
À1 around 38 days after
perihelion. (Data from Marshall et al. 2017b)
Fig. 3.8 MIRO observations from the 60 day period when the sub-solar latitude was further south
than À32
. The plot shows production rate measurements as a function of sub-spacecraft latitude
and indicates the strong asymmetry in water production between the northern and southern hemispheres at this time. A crude polynomial fit is also shown indicating a factor of 4–5 difference
between the south and the north at mid-latitudes. (Data from Marshall et al. 2017b)
3.2 Major Species and Their Emissions
195