

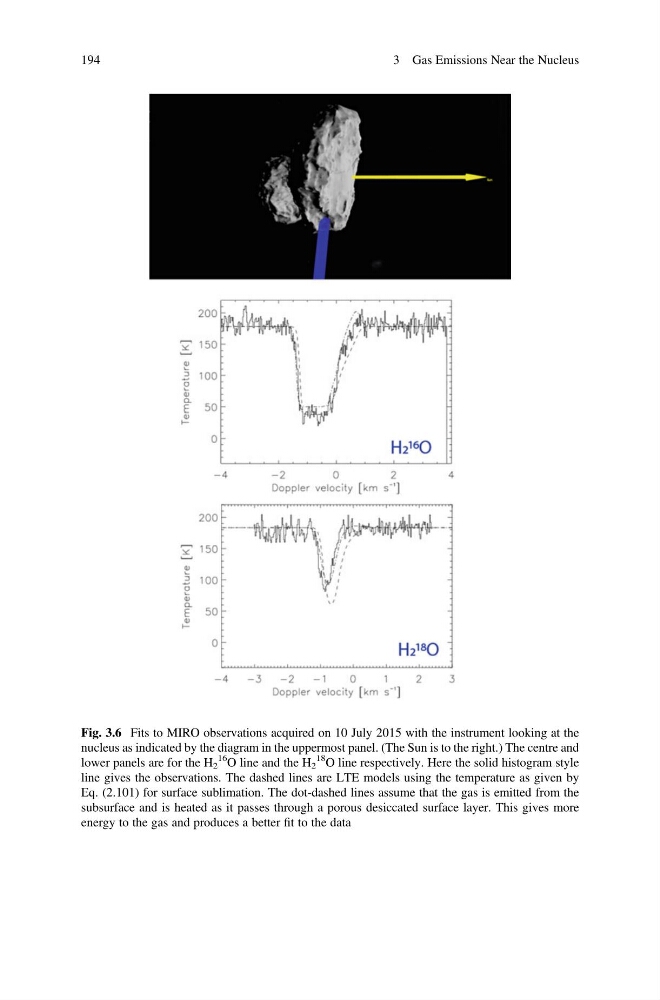
Fig. 3.6 Fits to MIRO observations acquired on 10 July 2015 with the instrument looking at the
nucleus as indicated by the diagram in the uppermost panel. (The Sun is to the right.) The centre and
lower panels are for the H 2
16
O line and the H 2
18
O line respectively. Here the solid histogram style
line gives the observations. The dashed lines are LTE models using the temperature as given by
Eq. (2.101) for surface sublimation. The dot-dashed lines assume that the gas is emitted from the
subsurface and is heated as it passes through a porous desiccated surface layer. This gives more
energy to the gas and produces a better fit to the data
194
3 Gas Emissions Near the Nucleus
nucleus as indicated by the diagram in the uppermost panel. (The Sun is to the right.) The centre and
lower panels are for the H 2
16
O line and the H 2
18
O line respectively. Here the solid histogram style
line gives the observations. The dashed lines are LTE models using the temperature as given by
Eq. (2.101) for surface sublimation. The dot-dashed lines assume that the gas is emitted from the
subsurface and is heated as it passes through a porous desiccated surface layer. This gives more
energy to the gas and produces a better fit to the data
194
3 Gas Emissions Near the Nucleus