

observed line widths resulting in the production rates shown in Fig. 3.7. The subset
of MIRO data used was spectra acquired in absorption with the instrument viewing
the nucleus as the example in Fig. 3.3 shows.
In the resulting measurements by Marshall et al., there is significant variance in
the resulting production rates which may be the result of the method. Much of the
data was acquired close to the terminator where large gradients in the gas column
density are to be expected. Nonetheless a strong latitudinal dependence of the gas
emission was evident as can be seen in Fig. 3.8 where observations acquired near
perihelion with the sub-solar point at high southern latitudes (>32
S) have been
extracted and plotted against sub-spacecraft latitudes. The north-south asymmetry is
clearly evident.
The MIRO dataset is large and quite rich. It also includes measurements of CO
(J ¼ 5 ! 4) line as well as the ammonia (10–00) line (572.498 GHz) and three lines
of methanol. A surprising result, however, was that the CO line is extremely weak
(and mostly undetectable) in the data set.
Vibrational bands of the three major species (CO, CO 2 , and H 2 O) can be found in
the 2.6–4.8 μm wavelength range. The vibration of the CO molecule is not as
straightforward as the rotation because the stretching of the molecule is non-linear
when compared to a mechanical spring and hence the harmonic approximations are
inadequate. This can be overcome by setting up an expression for the potential
energy as a function of the separation of the two atoms with the expression having
sufficient terms to fit the anharmonicity. In the simplest case, the quantized energy is
given by the equation
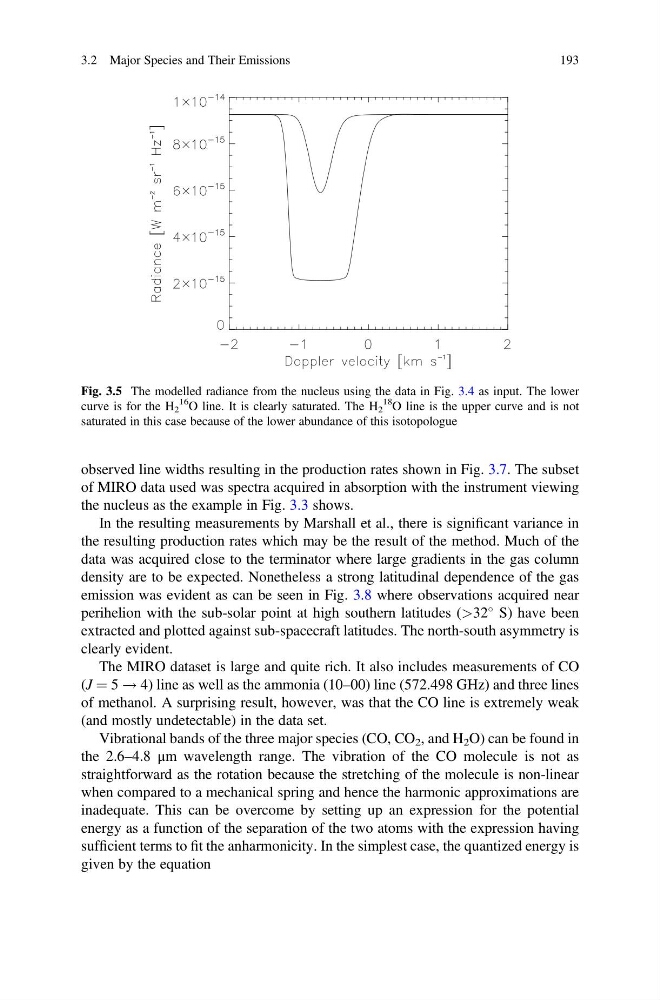
Fig. 3.5 The modelled radiance from the nucleus using the data in Fig. 3.4 as input. The lower
curve is for the H 2
16
O line. It is clearly saturated. The H 2
18
O line is the upper curve and is not
saturated in this case because of the lower abundance of this isotopologue
3.2 Major Species and Their Emissions
193
of MIRO data used was spectra acquired in absorption with the instrument viewing
the nucleus as the example in Fig. 3.3 shows.
In the resulting measurements by Marshall et al., there is significant variance in
the resulting production rates which may be the result of the method. Much of the
data was acquired close to the terminator where large gradients in the gas column
density are to be expected. Nonetheless a strong latitudinal dependence of the gas
emission was evident as can be seen in Fig. 3.8 where observations acquired near
perihelion with the sub-solar point at high southern latitudes (>32
S) have been
extracted and plotted against sub-spacecraft latitudes. The north-south asymmetry is
clearly evident.
The MIRO dataset is large and quite rich. It also includes measurements of CO
(J ¼ 5 ! 4) line as well as the ammonia (10–00) line (572.498 GHz) and three lines
of methanol. A surprising result, however, was that the CO line is extremely weak
(and mostly undetectable) in the data set.
Vibrational bands of the three major species (CO, CO 2 , and H 2 O) can be found in
the 2.6–4.8 μm wavelength range. The vibration of the CO molecule is not as
straightforward as the rotation because the stretching of the molecule is non-linear
when compared to a mechanical spring and hence the harmonic approximations are
inadequate. This can be overcome by setting up an expression for the potential
energy as a function of the separation of the two atoms with the expression having
sufficient terms to fit the anharmonicity. In the simplest case, the quantized energy is
given by the equation
Fig. 3.5 The modelled radiance from the nucleus using the data in Fig. 3.4 as input. The lower
curve is for the H 2
16
O line. It is clearly saturated. The H 2
18
O line is the upper curve and is not
saturated in this case because of the lower abundance of this isotopologue
3.2 Major Species and Their Emissions
193