

zenith angle and provides a better result. This will be discussed later in the context of
surface porosity and sub-surface sublimation. Note that the high temperature wing of
the H 2
16 O line is seen in the higher temperature model (although the fit here is not
ideal).
Marshall et al. (2017a, 2017b) used the isotopologues to produce estimated water
production rates for 67P through the Rosetta mission by integrating over the
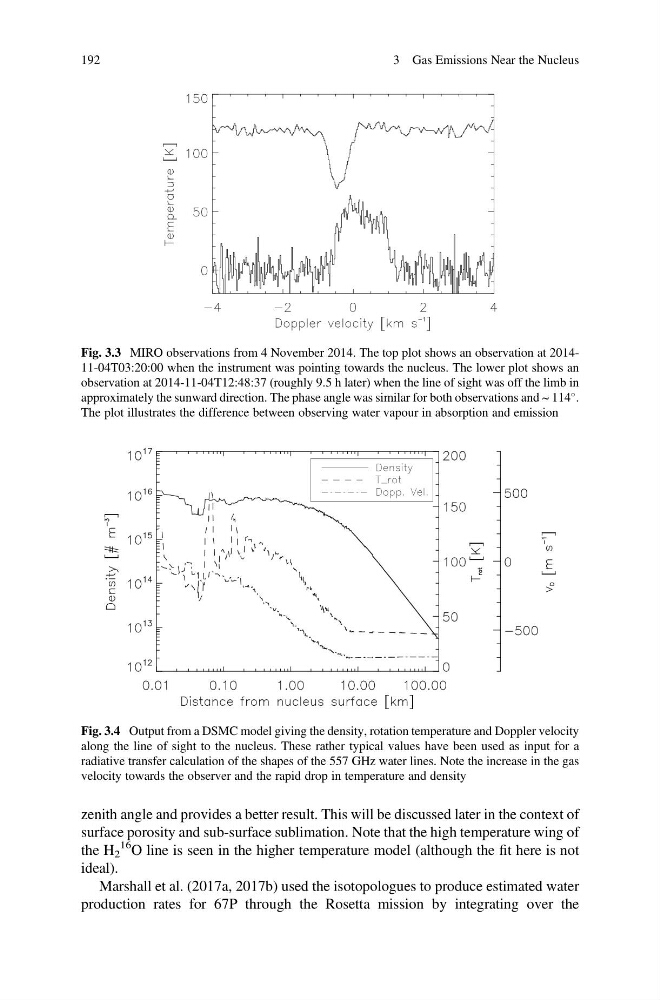
Fig. 3.3 MIRO observations from 4 November 2014. The top plot shows an observation at 201411-04T03:20:00 when the instrument was pointing towards the nucleus. The lower plot shows an
observation at 2014-11-04T12:48:37 (roughly 9.5 h later) when the line of sight was off the limb in
approximately the sunward direction. The phase angle was similar for both observations and ~ 114
.
The plot illustrates the difference between observing water vapour in absorption and emission
Fig. 3.4 Output from a DSMC model giving the density, rotation temperature and Doppler velocity
along the line of sight to the nucleus. These rather typical values have been used as input for a
radiative transfer calculation of the shapes of the 557 GHz water lines. Note the increase in the gas
velocity towards the observer and the rapid drop in temperature and density
192
3 Gas Emissions Near the Nucleus
surface porosity and sub-surface sublimation. Note that the high temperature wing of
the H 2
16 O line is seen in the higher temperature model (although the fit here is not
ideal).
Marshall et al. (2017a, 2017b) used the isotopologues to produce estimated water
production rates for 67P through the Rosetta mission by integrating over the
Fig. 3.3 MIRO observations from 4 November 2014. The top plot shows an observation at 201411-04T03:20:00 when the instrument was pointing towards the nucleus. The lower plot shows an
observation at 2014-11-04T12:48:37 (roughly 9.5 h later) when the line of sight was off the limb in
approximately the sunward direction. The phase angle was similar for both observations and ~ 114
.
The plot illustrates the difference between observing water vapour in absorption and emission
Fig. 3.4 Output from a DSMC model giving the density, rotation temperature and Doppler velocity
along the line of sight to the nucleus. These rather typical values have been used as input for a
radiative transfer calculation of the shapes of the 557 GHz water lines. Note the increase in the gas
velocity towards the observer and the rapid drop in temperature and density
192
3 Gas Emissions Near the Nucleus