

techniques to provide very high resolution spectra (e.g. Hartogh 1997). This can then
be used to determine the exact width of isolated lines. Water emission at 557 GHz
(18.58 cm
À1 ) is one of the principal emissions of interest (Table 3.3) and, for this
reason, a microwave radiometer experiment (MIRO) was selected for flight on the
Rosetta spacecraft. This emission line is particularly strong and optical thickness
effects must be taken into account for lines of sight passing close to the nucleus even
at relatively high heliocentric distances. The use of Eq. (3.20) with the optical
thickness terms is therefore required. However, observing the nearby spectral lines
of the isotopologues of H 2 O can be used to remove (or reduce) optical thickness
effects under the assumption that relative abundances of the isotopologues to the
main isotopologue are known and invariant. The frequencies of the isotopologues of
H 2 O for the 1(1,0)-1(0,1) transition are shown in Table 3.3 and were all observed by
the Rosetta/MIRO experiment.
The FWHM of the thermally broadened line is given by Eq. (3.25) which shows
that a resolving power of ~300 kHz is needed to determine the molecular temperature. The spectral resolution of the MIRO spectrometer on Rosetta was around
44 kHz.
When viewing water vapour in the coma above the limb of the nucleus, one sees
the species in emission against the low temperature of deep space (nominally 2.7 K).
On the other hand, the nucleus can provide an emission source with the water
molecules in the line of sight from the nucleus to the instrument absorbing that
emission because the water vapour is colder than the nucleus as a consequence of the
initial expansion. Hence, in this case one sees the water vapour in absorption. This
effect was first expressed in Kirchhoff’s three laws of spectroscopy which are
1. A solid, liquid, or dense gas emits light at all wavelengths.
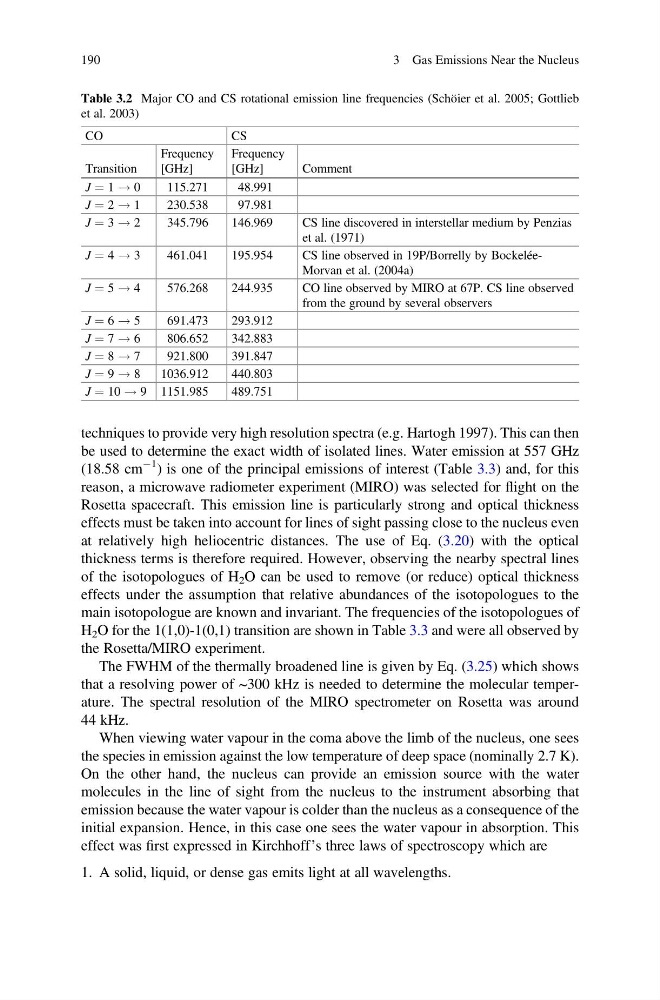
Table 3.2 Major CO and CS rotational emission line frequencies (Schöier et al. 2005; Gottlieb
et al. 2003)
CO
CS
Transition
Frequency
[GHz]
Frequency
[GHz]
Comment
J ¼ 1 ! 0
115.271
48.991
J ¼ 2 ! 1
230.538
97.981
J ¼ 3 ! 2
345.796
146.969
CS line discovered in interstellar medium by Penzias
et al. (1971)
J ¼ 4 ! 3
461.041
195.954
CS line observed in 19P/Borrelly by BockeléeMorvan et al. (2004a)
J ¼ 5 ! 4
576.268
244.935
CO line observed by MIRO at 67P. CS line observed
from the ground by several observers
J ¼ 6 ! 5
691.473
293.912
J ¼ 7 ! 6
806.652
342.883
J ¼ 8 ! 7
921.800
391.847
J ¼ 9 ! 8
1036.912
440.803
J ¼ 10 ! 9 1151.985
489.751
190
3 Gas Emissions Near the Nucleus
be used to determine the exact width of isolated lines. Water emission at 557 GHz
(18.58 cm
À1 ) is one of the principal emissions of interest (Table 3.3) and, for this
reason, a microwave radiometer experiment (MIRO) was selected for flight on the
Rosetta spacecraft. This emission line is particularly strong and optical thickness
effects must be taken into account for lines of sight passing close to the nucleus even
at relatively high heliocentric distances. The use of Eq. (3.20) with the optical
thickness terms is therefore required. However, observing the nearby spectral lines
of the isotopologues of H 2 O can be used to remove (or reduce) optical thickness
effects under the assumption that relative abundances of the isotopologues to the
main isotopologue are known and invariant. The frequencies of the isotopologues of
H 2 O for the 1(1,0)-1(0,1) transition are shown in Table 3.3 and were all observed by
the Rosetta/MIRO experiment.
The FWHM of the thermally broadened line is given by Eq. (3.25) which shows
that a resolving power of ~300 kHz is needed to determine the molecular temperature. The spectral resolution of the MIRO spectrometer on Rosetta was around
44 kHz.
When viewing water vapour in the coma above the limb of the nucleus, one sees
the species in emission against the low temperature of deep space (nominally 2.7 K).
On the other hand, the nucleus can provide an emission source with the water
molecules in the line of sight from the nucleus to the instrument absorbing that
emission because the water vapour is colder than the nucleus as a consequence of the
initial expansion. Hence, in this case one sees the water vapour in absorption. This
effect was first expressed in Kirchhoff’s three laws of spectroscopy which are
1. A solid, liquid, or dense gas emits light at all wavelengths.
Table 3.2 Major CO and CS rotational emission line frequencies (Schöier et al. 2005; Gottlieb
et al. 2003)
CO
CS
Transition
Frequency
[GHz]
Frequency
[GHz]
Comment
J ¼ 1 ! 0
115.271
48.991
J ¼ 2 ! 1
230.538
97.981
J ¼ 3 ! 2
345.796
146.969
CS line discovered in interstellar medium by Penzias
et al. (1971)
J ¼ 4 ! 3
461.041
195.954
CS line observed in 19P/Borrelly by BockeléeMorvan et al. (2004a)
J ¼ 5 ! 4
576.268
244.935
CO line observed by MIRO at 67P. CS line observed
from the ground by several observers
J ¼ 6 ! 5
691.473
293.912
J ¼ 7 ! 6
806.652
342.883
J ¼ 8 ! 7
921.800
391.847
J ¼ 9 ! 8
1036.912
440.803
J ¼ 10 ! 9 1151.985
489.751
190
3 Gas Emissions Near the Nucleus