

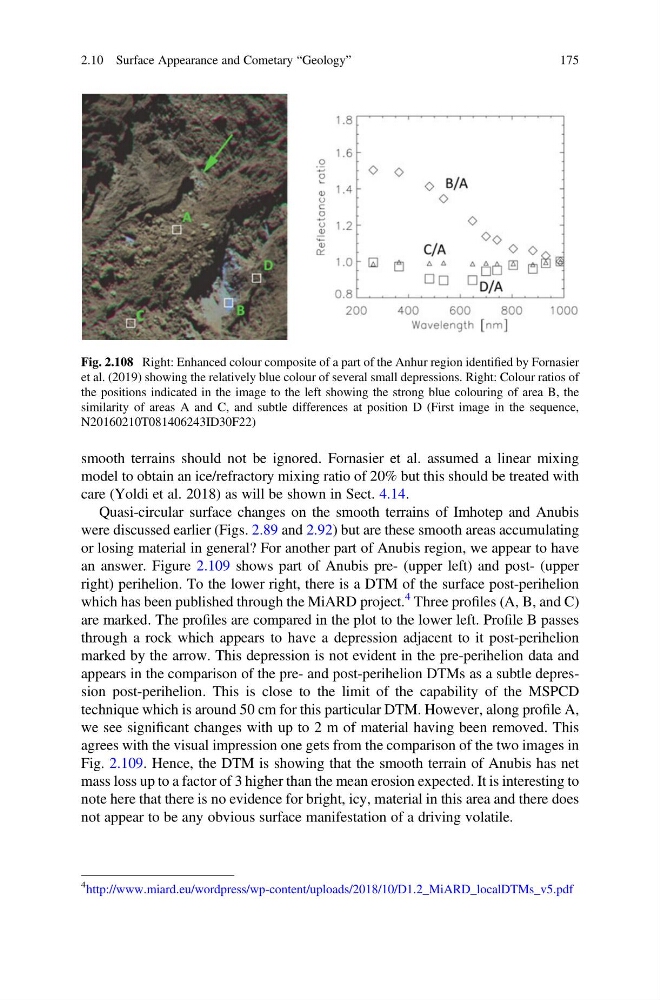
smooth terrains should not be ignored. Fornasier et al. assumed a linear mixing
model to obtain an ice/refractory mixing ratio of 20% but this should be treated with
care (Yoldi et al. 2018) as will be shown in Sect. 4.14.
Quasi-circular surface changes on the smooth terrains of Imhotep and Anubis
were discussed earlier (Figs. 2.89 and 2.92) but are these smooth areas accumulating
or losing material in general? For another part of Anubis region, we appear to have
an answer. Figure 2.109 shows part of Anubis pre- (upper left) and post- (upper
right) perihelion. To the lower right, there is a DTM of the surface post-perihelion
which has been published through the MiARD project.
4 Three profiles (A, B, and C)
are marked. The profiles are compared in the plot to the lower left. Profile B passes
through a rock which appears to have a depression adjacent to it post-perihelion
marked by the arrow. This depression is not evident in the pre-perihelion data and
appears in the comparison of the pre- and post-perihelion DTMs as a subtle depression post-perihelion. This is close to the limit of the capability of the MSPCD
technique which is around 50 cm for this particular DTM. However, along profile A,
we see significant changes with up to 2 m of material having been removed. This
agrees with the visual impression one gets from the comparison of the two images in
Fig. 2.109. Hence, the DTM is showing that the smooth terrain of Anubis has net
mass loss up to a factor of 3 higher than the mean erosion expected. It is interesting to
note here that there is no evidence for bright, icy, material in this area and there does
not appear to be any obvious surface manifestation of a driving volatile.
Fig. 2.108 Right: Enhanced colour composite of a part of the Anhur region identified by Fornasier
et al. (2019) showing the relatively blue colour of several small depressions. Right: Colour ratios of
the positions indicated in the image to the left showing the strong blue colouring of area B, the
similarity of areas A and C, and subtle differences at position D (First image in the sequence,
N20160210T081406243ID30F22)
4 http://www.miard.eu/wordpress/wp-content/uploads/2018/10/D1.2_MiARD_localDTMs_v5.pdf
2.10 Surface Appearance and Cometary “Geology”
175
model to obtain an ice/refractory mixing ratio of 20% but this should be treated with
care (Yoldi et al. 2018) as will be shown in Sect. 4.14.
Quasi-circular surface changes on the smooth terrains of Imhotep and Anubis
were discussed earlier (Figs. 2.89 and 2.92) but are these smooth areas accumulating
or losing material in general? For another part of Anubis region, we appear to have
an answer. Figure 2.109 shows part of Anubis pre- (upper left) and post- (upper
right) perihelion. To the lower right, there is a DTM of the surface post-perihelion
which has been published through the MiARD project.
4 Three profiles (A, B, and C)
are marked. The profiles are compared in the plot to the lower left. Profile B passes
through a rock which appears to have a depression adjacent to it post-perihelion
marked by the arrow. This depression is not evident in the pre-perihelion data and
appears in the comparison of the pre- and post-perihelion DTMs as a subtle depression post-perihelion. This is close to the limit of the capability of the MSPCD
technique which is around 50 cm for this particular DTM. However, along profile A,
we see significant changes with up to 2 m of material having been removed. This
agrees with the visual impression one gets from the comparison of the two images in
Fig. 2.109. Hence, the DTM is showing that the smooth terrain of Anubis has net
mass loss up to a factor of 3 higher than the mean erosion expected. It is interesting to
note here that there is no evidence for bright, icy, material in this area and there does
not appear to be any obvious surface manifestation of a driving volatile.
Fig. 2.108 Right: Enhanced colour composite of a part of the Anhur region identified by Fornasier
et al. (2019) showing the relatively blue colour of several small depressions. Right: Colour ratios of
the positions indicated in the image to the left showing the strong blue colouring of area B, the
similarity of areas A and C, and subtle differences at position D (First image in the sequence,
N20160210T081406243ID30F22)
4 http://www.miard.eu/wordpress/wp-content/uploads/2018/10/D1.2_MiARD_localDTMs_v5.pdf
2.10 Surface Appearance and Cometary “Geology”
175