

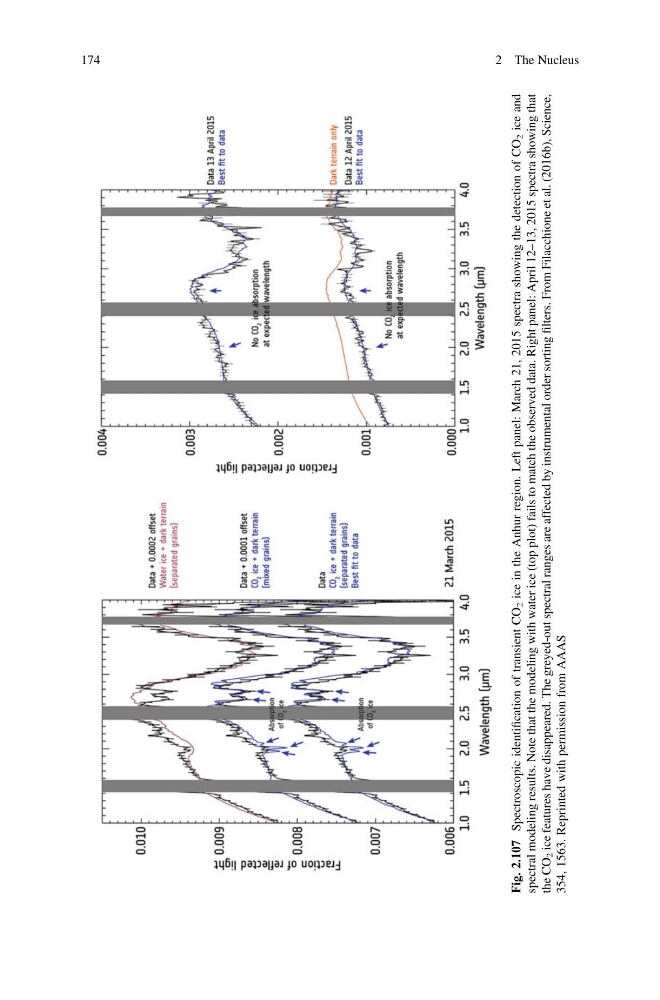
Fig. 2.107
Spectroscopic identification of transient CO
2 ice in the Anhur region. Left panel: March 21, 2015 spectra showing the detection of CO
2 ice and
spectral modeling results. Note that the modeling with water ice (top plot) fails to match the observed data. Right panel: April 12–13, 2015 spectra showing that
the CO
2 ice features have disappeared. The greyed-out spectral ranges are affected by instrumental order sorting
filters. From Filacchione et al. (2016b), Science,
354, 1563. Reprinted with permission from AAAS
174
2 The Nucleus
Spectroscopic identification of transient CO
2 ice in the Anhur region. Left panel: March 21, 2015 spectra showing the detection of CO
2 ice and
spectral modeling results. Note that the modeling with water ice (top plot) fails to match the observed data. Right panel: April 12–13, 2015 spectra showing that
the CO
2 ice features have disappeared. The greyed-out spectral ranges are affected by instrumental order sorting
filters. From Filacchione et al. (2016b), Science,
354, 1563. Reprinted with permission from AAAS
174
2 The Nucleus