

numerical model by Durán et al. (2012), predicted threshold wind shear velocities
that were also fairly extreme (e.g., u th ¼ 45 m s
À1 for a ¼ 0.5 cm) but such values are
feasible. Using a large number of assumptions, Jia et al. (2017) constructed a selfconsistent model that also illustrated the feasibility of ripple production under
67P-like conditions.
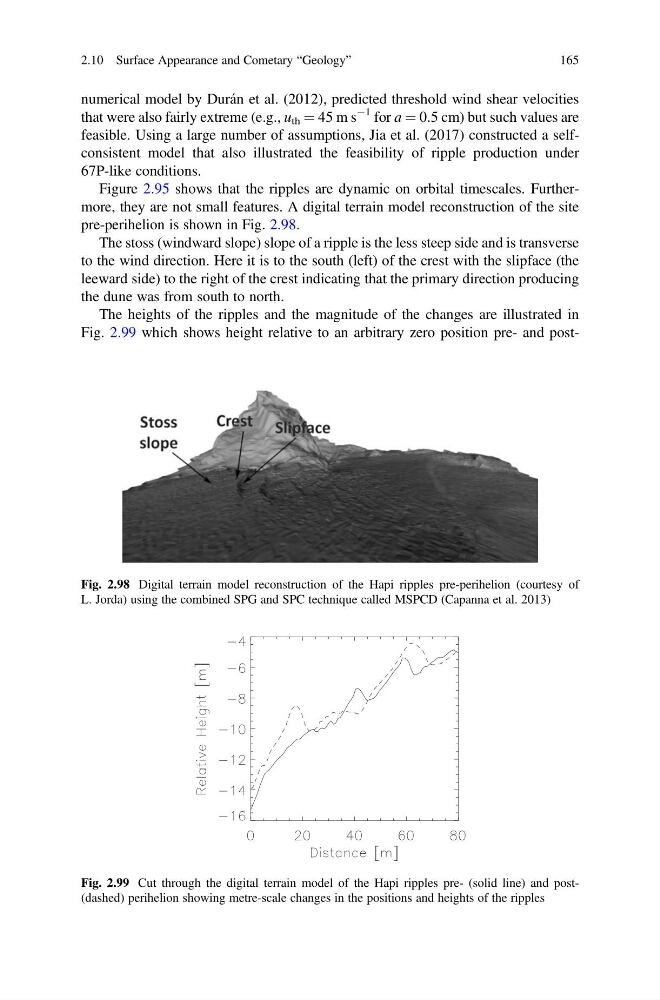
Figure 2.95 shows that the ripples are dynamic on orbital timescales. Furthermore, they are not small features. A digital terrain model reconstruction of the site
pre-perihelion is shown in Fig. 2.98.
The stoss (windward slope) slope of a ripple is the less steep side and is transverse
to the wind direction. Here it is to the south (left) of the crest with the slipface (the
leeward side) to the right of the crest indicating that the primary direction producing
the dune was from south to north.
The heights of the ripples and the magnitude of the changes are illustrated in
Fig. 2.99 which shows height relative to an arbitrary zero position pre- and postFig. 2.98 Digital terrain model reconstruction of the Hapi ripples pre-perihelion (courtesy of
L. Jorda) using the combined SPG and SPC technique called MSPCD (Capanna et al. 2013)
Fig. 2.99 Cut through the digital terrain model of the Hapi ripples pre- (solid line) and post(dashed) perihelion showing metre-scale changes in the positions and heights of the ripples
2.10 Surface Appearance and Cometary “Geology”
165
that were also fairly extreme (e.g., u th ¼ 45 m s
À1 for a ¼ 0.5 cm) but such values are
feasible. Using a large number of assumptions, Jia et al. (2017) constructed a selfconsistent model that also illustrated the feasibility of ripple production under
67P-like conditions.
Figure 2.95 shows that the ripples are dynamic on orbital timescales. Furthermore, they are not small features. A digital terrain model reconstruction of the site
pre-perihelion is shown in Fig. 2.98.
The stoss (windward slope) slope of a ripple is the less steep side and is transverse
to the wind direction. Here it is to the south (left) of the crest with the slipface (the
leeward side) to the right of the crest indicating that the primary direction producing
the dune was from south to north.
The heights of the ripples and the magnitude of the changes are illustrated in
Fig. 2.99 which shows height relative to an arbitrary zero position pre- and postFig. 2.98 Digital terrain model reconstruction of the Hapi ripples pre-perihelion (courtesy of
L. Jorda) using the combined SPG and SPC technique called MSPCD (Capanna et al. 2013)
Fig. 2.99 Cut through the digital terrain model of the Hapi ripples pre- (solid line) and post(dashed) perihelion showing metre-scale changes in the positions and heights of the ripples
2.10 Surface Appearance and Cometary “Geology”
165