

reaches a maximum. However, it is notable that Imhotep is one of the regions on the
nucleus inferred to have a low total production rate (e.g. Marschall et al. 2016). It is
possible to imagine a mechanism whereby fluidization of the surface layer is
followed by settling. The return to a fairly flat surface as fluidization slows could
be the result of localized redistribution of dust as seen in the laboratory example
above (Fig. 2.87).
An alternative explanation for the return to a flat appearance is that it is a
consequence of the equipotential surface. Non-escaping particles fall back to the
nucleus preferentially into local potential minima. The Imhotep smooth surface
forms an equipotential surface as can be seen in Fig. 2.90. Effects of “splash”
(impact particles sputtering other particles from the surface) would simply increase
the transport and local smoothing. There are two difficulties with this model. First,
there are subtle albedo differences across the surface that would be difficult to
explain with a homogenized “rain” of particles from above. Second, there are local
points that are topographically lower than the smooth surface as can be seen by
oblique views of the edge of the smooth surface on Imhotep (e.g. Fig. 2.91). The
lower gravitational potential of this area is also evident in Fig. 2.90 (bottom left). To
maintain this as a viable explanation, a method to keep lower surfaces “clean” of
deposits is needed with the rather obvious idea of unseen gas emission being a prime
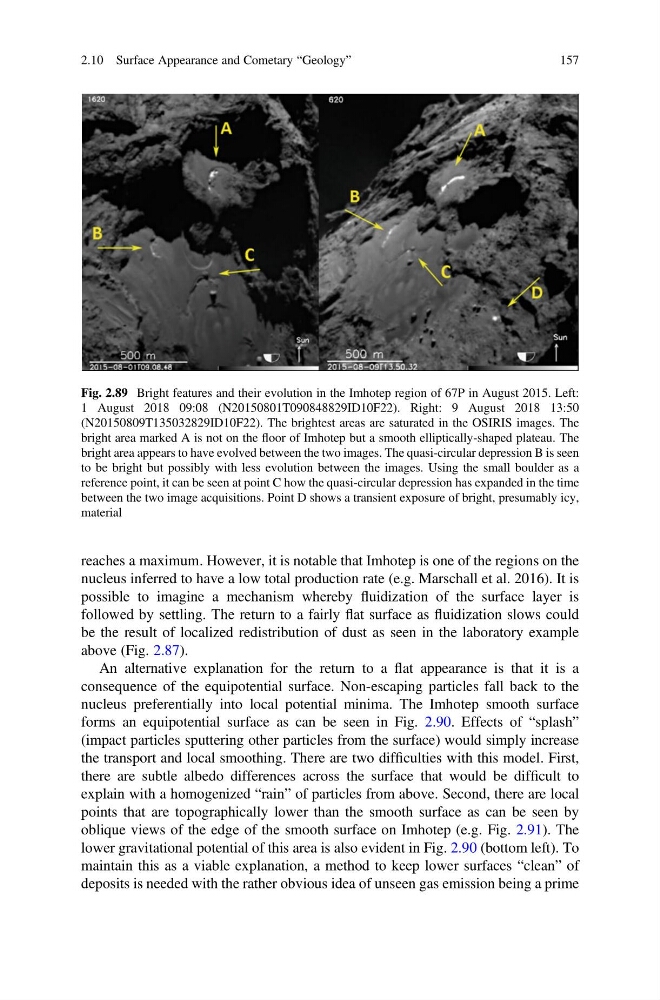
Fig. 2.89 Bright features and their evolution in the Imhotep region of 67P in August 2015. Left:
1 August 2018 09:08 (N20150801T090848829ID10F22). Right: 9 August 2018 13:50
(N20150809T135032829ID10F22). The brightest areas are saturated in the OSIRIS images. The
bright area marked A is not on the floor of Imhotep but a smooth elliptically-shaped plateau. The
bright area appears to have evolved between the two images. The quasi-circular depression B is seen
to be bright but possibly with less evolution between the images. Using the small boulder as a
reference point, it can be seen at point C how the quasi-circular depression has expanded in the time
between the two image acquisitions. Point D shows a transient exposure of bright, presumably icy,
material
2.10 Surface Appearance and Cometary “Geology”
157
nucleus inferred to have a low total production rate (e.g. Marschall et al. 2016). It is
possible to imagine a mechanism whereby fluidization of the surface layer is
followed by settling. The return to a fairly flat surface as fluidization slows could
be the result of localized redistribution of dust as seen in the laboratory example
above (Fig. 2.87).
An alternative explanation for the return to a flat appearance is that it is a
consequence of the equipotential surface. Non-escaping particles fall back to the
nucleus preferentially into local potential minima. The Imhotep smooth surface
forms an equipotential surface as can be seen in Fig. 2.90. Effects of “splash”
(impact particles sputtering other particles from the surface) would simply increase
the transport and local smoothing. There are two difficulties with this model. First,
there are subtle albedo differences across the surface that would be difficult to
explain with a homogenized “rain” of particles from above. Second, there are local
points that are topographically lower than the smooth surface as can be seen by
oblique views of the edge of the smooth surface on Imhotep (e.g. Fig. 2.91). The
lower gravitational potential of this area is also evident in Fig. 2.90 (bottom left). To
maintain this as a viable explanation, a method to keep lower surfaces “clean” of
deposits is needed with the rather obvious idea of unseen gas emission being a prime
Fig. 2.89 Bright features and their evolution in the Imhotep region of 67P in August 2015. Left:
1 August 2018 09:08 (N20150801T090848829ID10F22). Right: 9 August 2018 13:50
(N20150809T135032829ID10F22). The brightest areas are saturated in the OSIRIS images. The
bright area marked A is not on the floor of Imhotep but a smooth elliptically-shaped plateau. The
bright area appears to have evolved between the two images. The quasi-circular depression B is seen
to be bright but possibly with less evolution between the images. Using the small boulder as a
reference point, it can be seen at point C how the quasi-circular depression has expanded in the time
between the two image acquisitions. Point D shows a transient exposure of bright, presumably icy,
material
2.10 Surface Appearance and Cometary “Geology”
157