

velocity components of these particles into or out of the image plane are relatively
large.
In Fig. 2.81, one can see further evidence of low velocity particles. The jet-like
structure to the lower right of the nucleus appears strongly curved (Lin et al. 2016).
The curvature in projection here is towards the Sun direction which is the opposite of
what one would expect if gas drag (another potential process to produce non-radial
flow) or solar radiation pressure were responsible. The combination of low velocities
and nucleus rotation is therefore the most likely explanation. The sub-spacecraft
latitude at the time of this observation was 76.6
south implying that we are looking
almost pole on so that projection effects should be small. Hence, the outflow velocity
can be estimated directly from the curvature giving ≳1.1 m s
À1 . Marschall et al.
(2019) showed for one example on 5 May 2015 that, while the dust velocity was low,
it was above escape velocity and accelerating presumably because of gas drag.
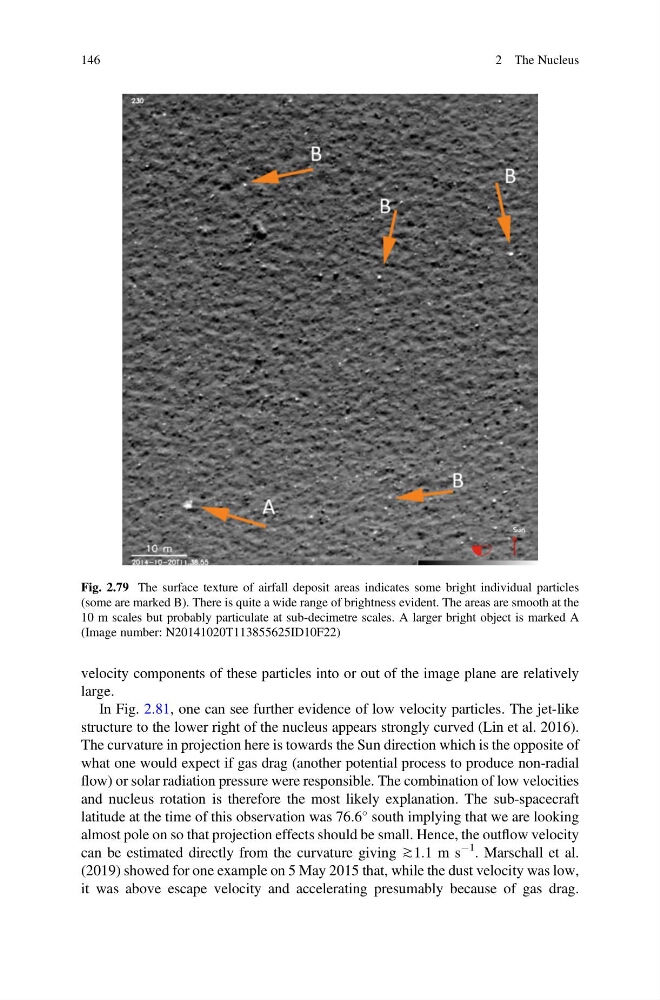
Fig. 2.79 The surface texture of airfall deposit areas indicates some bright individual particles
(some are marked B). There is quite a wide range of brightness evident. The areas are smooth at the
10 m scales but probably particulate at sub-decimetre scales. A larger bright object is marked A
(Image number: N20141020T113855625ID10F22)
146
2 The Nucleus
large.
In Fig. 2.81, one can see further evidence of low velocity particles. The jet-like
structure to the lower right of the nucleus appears strongly curved (Lin et al. 2016).
The curvature in projection here is towards the Sun direction which is the opposite of
what one would expect if gas drag (another potential process to produce non-radial
flow) or solar radiation pressure were responsible. The combination of low velocities
and nucleus rotation is therefore the most likely explanation. The sub-spacecraft
latitude at the time of this observation was 76.6
south implying that we are looking
almost pole on so that projection effects should be small. Hence, the outflow velocity
can be estimated directly from the curvature giving ≳1.1 m s
À1 . Marschall et al.
(2019) showed for one example on 5 May 2015 that, while the dust velocity was low,
it was above escape velocity and accelerating presumably because of gas drag.
Fig. 2.79 The surface texture of airfall deposit areas indicates some bright individual particles
(some are marked B). There is quite a wide range of brightness evident. The areas are smooth at the
10 m scales but probably particulate at sub-decimetre scales. A larger bright object is marked A
(Image number: N20141020T113855625ID10F22)
146
2 The Nucleus