

the obliquity of the rotation axis, would lead to south-facing surfaces being devoid of
deposits and produce transport of material from the south to the no longer illuminated north-facing surface facets. Hence, much of the material seen on the surfaces
of Ash and Ma’at may actually have been ejected from the southern hemisphere of
the nucleus. This would add to (and possibly even dominate) deposits arising from
dust emission from the highly active north-facing Hapi region pre-equinox.
The second evidence for airfall comes from the trajectories of particles seen
during rapid imaging sequences by OSIRIS. These fall into three categories. The
trajectories of some near-nucleus particles within a specific imaging sequence were
described by Agarwal et al. (2016). Adding together multiple images from such a
sequence reveals particle motion very clearly. An example is shown in Fig. 2.80.
The projected velocities of some of the lower velocity particles in Fig. 2.80 are
below 0.35 m s
À1 and hence nearly a factor of 2 below escape velocity. Consequently, it is highly likely that particles are re-impacting the surface even if the
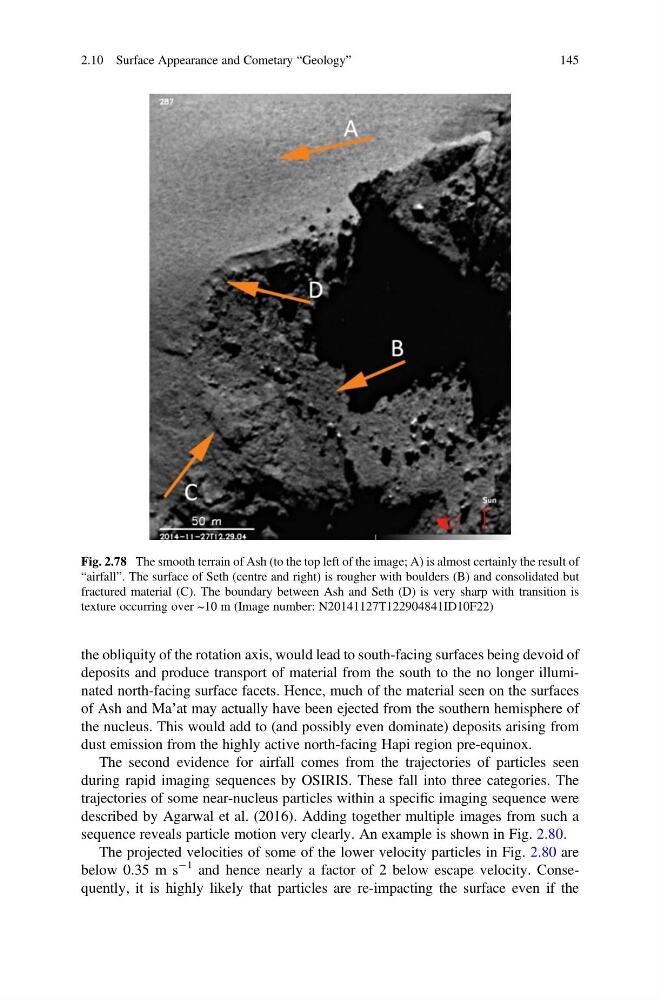
Fig. 2.78 The smooth terrain of Ash (to the top left of the image; A) is almost certainly the result of
“airfall”. The surface of Seth (centre and right) is rougher with boulders (B) and consolidated but
fractured material (C). The boundary between Ash and Seth (D) is very sharp with transition is
texture occurring over ~10 m (Image number: N20141127T122904841ID10F22)
2.10 Surface Appearance and Cometary “Geology”
145
deposits and produce transport of material from the south to the no longer illuminated north-facing surface facets. Hence, much of the material seen on the surfaces
of Ash and Ma’at may actually have been ejected from the southern hemisphere of
the nucleus. This would add to (and possibly even dominate) deposits arising from
dust emission from the highly active north-facing Hapi region pre-equinox.
The second evidence for airfall comes from the trajectories of particles seen
during rapid imaging sequences by OSIRIS. These fall into three categories. The
trajectories of some near-nucleus particles within a specific imaging sequence were
described by Agarwal et al. (2016). Adding together multiple images from such a
sequence reveals particle motion very clearly. An example is shown in Fig. 2.80.
The projected velocities of some of the lower velocity particles in Fig. 2.80 are
below 0.35 m s
À1 and hence nearly a factor of 2 below escape velocity. Consequently, it is highly likely that particles are re-impacting the surface even if the
Fig. 2.78 The smooth terrain of Ash (to the top left of the image; A) is almost certainly the result of
“airfall”. The surface of Seth (centre and right) is rougher with boulders (B) and consolidated but
fractured material (C). The boundary between Ash and Seth (D) is very sharp with transition is
texture occurring over ~10 m (Image number: N20141127T122904841ID10F22)
2.10 Surface Appearance and Cometary “Geology”
145