

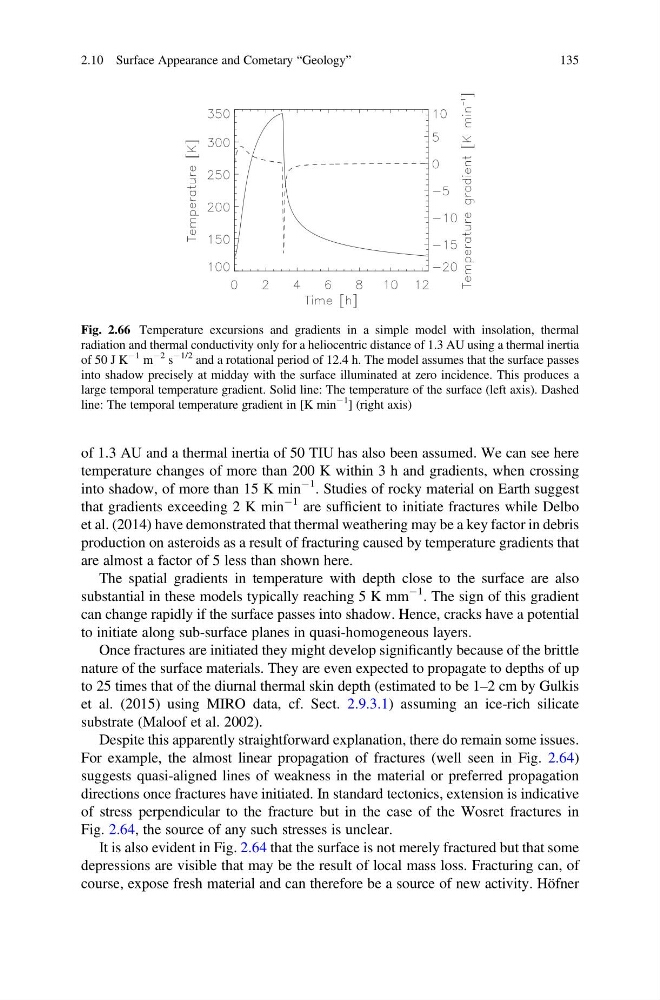
of 1.3 AU and a thermal inertia of 50 TIU has also been assumed. We can see here
temperature changes of more than 200 K within 3 h and gradients, when crossing
into shadow, of more than 15 K min
À1 . Studies of rocky material on Earth suggest
that gradients exceeding 2 K min
À1 are sufficient to initiate fractures while Delbo
et al. (2014) have demonstrated that thermal weathering may be a key factor in debris
production on asteroids as a result of fracturing caused by temperature gradients that
are almost a factor of 5 less than shown here.
The spatial gradients in temperature with depth close to the surface are also
substantial in these models typically reaching 5 K mm
À1 . The sign of this gradient
can change rapidly if the surface passes into shadow. Hence, cracks have a potential
to initiate along sub-surface planes in quasi-homogeneous layers.
Once fractures are initiated they might develop significantly because of the brittle
nature of the surface materials. They are even expected to propagate to depths of up
to 25 times that of the diurnal thermal skin depth (estimated to be 1–2 cm by Gulkis
et al. (2015) using MIRO data, cf. Sect. 2.9.3.1) assuming an ice-rich silicate
substrate (Maloof et al. 2002).
Despite this apparently straightforward explanation, there do remain some issues.
For example, the almost linear propagation of fractures (well seen in Fig. 2.64)
suggests quasi-aligned lines of weakness in the material or preferred propagation
directions once fractures have initiated. In standard tectonics, extension is indicative
of stress perpendicular to the fracture but in the case of the Wosret fractures in
Fig. 2.64, the source of any such stresses is unclear.
It is also evident in Fig. 2.64 that the surface is not merely fractured but that some
depressions are visible that may be the result of local mass loss. Fracturing can, of
course, expose fresh material and can therefore be a source of new activity. Höfner
Fig. 2.66 Temperature excursions and gradients in a simple model with insolation, thermal
radiation and thermal conductivity only for a heliocentric distance of 1.3 AU using a thermal inertia
of 50 J K
À1 m
À2 s
À1/2 and a rotational period of 12.4 h. The model assumes that the surface passes
into shadow precisely at midday with the surface illuminated at zero incidence. This produces a
large temporal temperature gradient. Solid line: The temperature of the surface (left axis). Dashed
line: The temporal temperature gradient in [K min
À1
] (right axis)
2.10 Surface Appearance and Cometary “Geology”
135
temperature changes of more than 200 K within 3 h and gradients, when crossing
into shadow, of more than 15 K min
À1 . Studies of rocky material on Earth suggest
that gradients exceeding 2 K min
À1 are sufficient to initiate fractures while Delbo
et al. (2014) have demonstrated that thermal weathering may be a key factor in debris
production on asteroids as a result of fracturing caused by temperature gradients that
are almost a factor of 5 less than shown here.
The spatial gradients in temperature with depth close to the surface are also
substantial in these models typically reaching 5 K mm
À1 . The sign of this gradient
can change rapidly if the surface passes into shadow. Hence, cracks have a potential
to initiate along sub-surface planes in quasi-homogeneous layers.
Once fractures are initiated they might develop significantly because of the brittle
nature of the surface materials. They are even expected to propagate to depths of up
to 25 times that of the diurnal thermal skin depth (estimated to be 1–2 cm by Gulkis
et al. (2015) using MIRO data, cf. Sect. 2.9.3.1) assuming an ice-rich silicate
substrate (Maloof et al. 2002).
Despite this apparently straightforward explanation, there do remain some issues.
For example, the almost linear propagation of fractures (well seen in Fig. 2.64)
suggests quasi-aligned lines of weakness in the material or preferred propagation
directions once fractures have initiated. In standard tectonics, extension is indicative
of stress perpendicular to the fracture but in the case of the Wosret fractures in
Fig. 2.64, the source of any such stresses is unclear.
It is also evident in Fig. 2.64 that the surface is not merely fractured but that some
depressions are visible that may be the result of local mass loss. Fracturing can, of
course, expose fresh material and can therefore be a source of new activity. Höfner
Fig. 2.66 Temperature excursions and gradients in a simple model with insolation, thermal
radiation and thermal conductivity only for a heliocentric distance of 1.3 AU using a thermal inertia
of 50 J K
À1 m
À2 s
À1/2 and a rotational period of 12.4 h. The model assumes that the surface passes
into shadow precisely at midday with the surface illuminated at zero incidence. This produces a
large temporal temperature gradient. Solid line: The temperature of the surface (left axis). Dashed
line: The temporal temperature gradient in [K min
À1
] (right axis)
2.10 Surface Appearance and Cometary “Geology”
135