

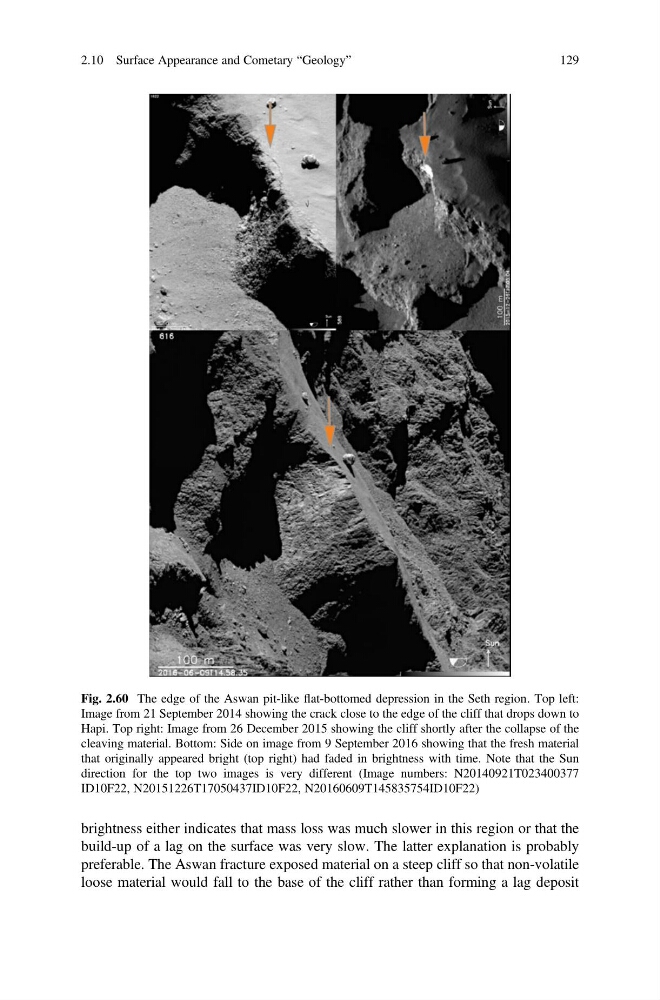
brightness either indicates that mass loss was much slower in this region or that the
build-up of a lag on the surface was very slow. The latter explanation is probably
preferable. The Aswan fracture exposed material on a steep cliff so that non-volatile
loose material would fall to the base of the cliff rather than forming a lag deposit
Fig. 2.60 The edge of the Aswan pit-like flat-bottomed depression in the Seth region. Top left:
Image from 21 September 2014 showing the crack close to the edge of the cliff that drops down to
Hapi. Top right: Image from 26 December 2015 showing the cliff shortly after the collapse of the
cleaving material. Bottom: Side on image from 9 September 2016 showing that the fresh material
that originally appeared bright (top right) had faded in brightness with time. Note that the Sun
direction for the top two images is very different (Image numbers: N20140921T023400377
ID10F22, N20151226T17050437ID10F22, N20160609T145835754ID10F22)
2.10 Surface Appearance and Cometary “Geology”
129
build-up of a lag on the surface was very slow. The latter explanation is probably
preferable. The Aswan fracture exposed material on a steep cliff so that non-volatile
loose material would fall to the base of the cliff rather than forming a lag deposit
Fig. 2.60 The edge of the Aswan pit-like flat-bottomed depression in the Seth region. Top left:
Image from 21 September 2014 showing the crack close to the edge of the cliff that drops down to
Hapi. Top right: Image from 26 December 2015 showing the cliff shortly after the collapse of the
cleaving material. Bottom: Side on image from 9 September 2016 showing that the fresh material
that originally appeared bright (top right) had faded in brightness with time. Note that the Sun
direction for the top two images is very different (Image numbers: N20140921T023400377
ID10F22, N20151226T17050437ID10F22, N20160609T145835754ID10F22)
2.10 Surface Appearance and Cometary “Geology”
129