

initial assessment. This also illustrates that the heat required for the phase change is
much larger for water than for CO 2 or CO.
In equilibrium, the number of gas molecules striking the solid surface equals the
number being emitted from the surface and hence the flux of molecules crossing a
unit cross-section of the surface can be used to derive the emitted flux. The 3D
Maxwell-Boltzmann distribution can be used for this purpose resulting in the HertzKnudsen equation which provides the maximum gas emission rate, Z(T), from an ice
surface into vacuum,
Z T
ð Þ ¼
p s
ffiffiffiffiffiffiffiffiffiffiffiffiffiffi
2πmkT
p
ð2:95Þ
in [molecule m
À2 s
À1 ] (e.g. Steiner et al. 1991). Clearly, substitution for p s and m can
result in this equation having slightly different forms depending upon preference.
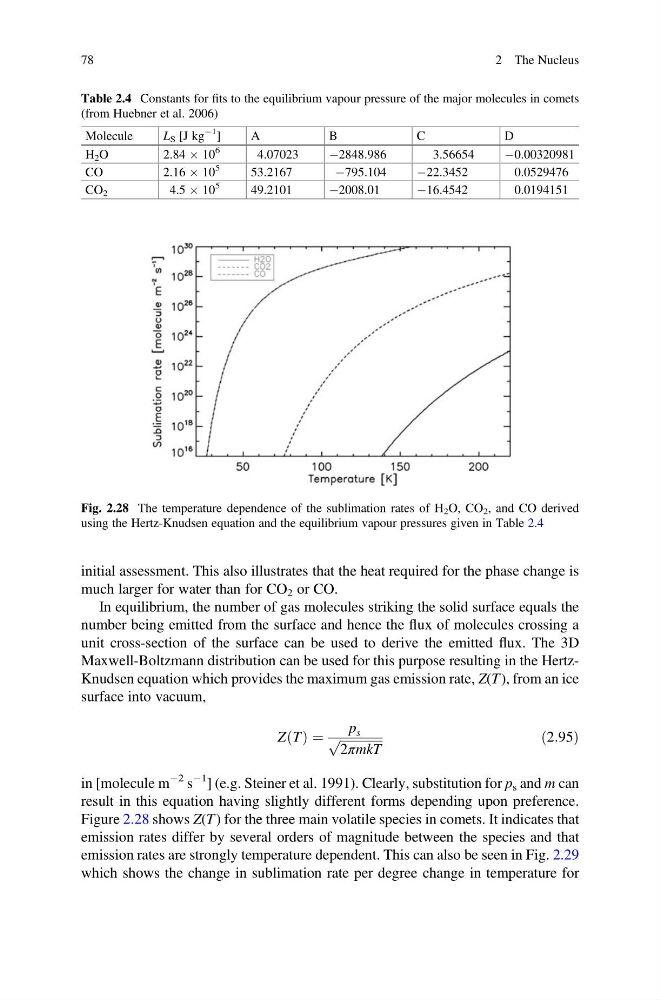
Figure 2.28 shows Z(T ) for the three main volatile species in comets. It indicates that
emission rates differ by several orders of magnitude between the species and that
emission rates are strongly temperature dependent. This can also be seen in Fig. 2.29
which shows the change in sublimation rate per degree change in temperature for
Table 2.4 Constants for fits to the equilibrium vapour pressure of the major molecules in comets
(from Huebner et al. 2006)
Molecule
L S [J kg
À1
]
A
B
C
D
H 2 O
2.84 Â 10
6
4.07023
À2848.986
3.56654
À0.00320981
CO
2.16 Â 10
5
53.2167
À795.104
À22.3452
0.0529476
CO 2
4.5 Â 10
5
49.2101
À2008.01
À16.4542
0.0194151
Fig. 2.28 The temperature dependence of the sublimation rates of H 2 O, CO 2 , and CO derived
using the Hertz-Knudsen equation and the equilibrium vapour pressures given in Table 2.4
78
2 The Nucleus
much larger for water than for CO 2 or CO.
In equilibrium, the number of gas molecules striking the solid surface equals the
number being emitted from the surface and hence the flux of molecules crossing a
unit cross-section of the surface can be used to derive the emitted flux. The 3D
Maxwell-Boltzmann distribution can be used for this purpose resulting in the HertzKnudsen equation which provides the maximum gas emission rate, Z(T), from an ice
surface into vacuum,
Z T
ð Þ ¼
p s
ffiffiffiffiffiffiffiffiffiffiffiffiffiffi
2πmkT
p
ð2:95Þ
in [molecule m
À2 s
À1 ] (e.g. Steiner et al. 1991). Clearly, substitution for p s and m can
result in this equation having slightly different forms depending upon preference.
Figure 2.28 shows Z(T ) for the three main volatile species in comets. It indicates that
emission rates differ by several orders of magnitude between the species and that
emission rates are strongly temperature dependent. This can also be seen in Fig. 2.29
which shows the change in sublimation rate per degree change in temperature for
Table 2.4 Constants for fits to the equilibrium vapour pressure of the major molecules in comets
(from Huebner et al. 2006)
Molecule
L S [J kg
À1
]
A
B
C
D
H 2 O
2.84 Â 10
6
4.07023
À2848.986
3.56654
À0.00320981
CO
2.16 Â 10
5
53.2167
À795.104
À22.3452
0.0529476
CO 2
4.5 Â 10
5
49.2101
À2008.01
À16.4542
0.0194151
Fig. 2.28 The temperature dependence of the sublimation rates of H 2 O, CO 2 , and CO derived
using the Hertz-Knudsen equation and the equilibrium vapour pressures given in Table 2.4
78
2 The Nucleus