

17.4.3 Growth Responses to Different GWL
Sago palm, a C 3 plant, consumes 50–100 mol of H 2 O through transpiration in order
to fix 1 mol of CO 2 through photosynthesis (Okazaki 2015). Generally, it is
perceived that plants typically suffer from oxygen starvation if they are immersed
in water and suffer oxygen damage when they are exposed to the air again (Okazaki
2015). Sago palms have recently been found to be able to grow in Morogoro,
Tanzania, a place with an annual precipitation of 900 mm and 5 months of dry
season from May to September (Tarimo et al. 2006). However, when we examined
the growth of two-year-old sago palm seedlings for 6 days under well-watered
condition and dry condition (À5, À40, À70 KPa soil water potential at the second,
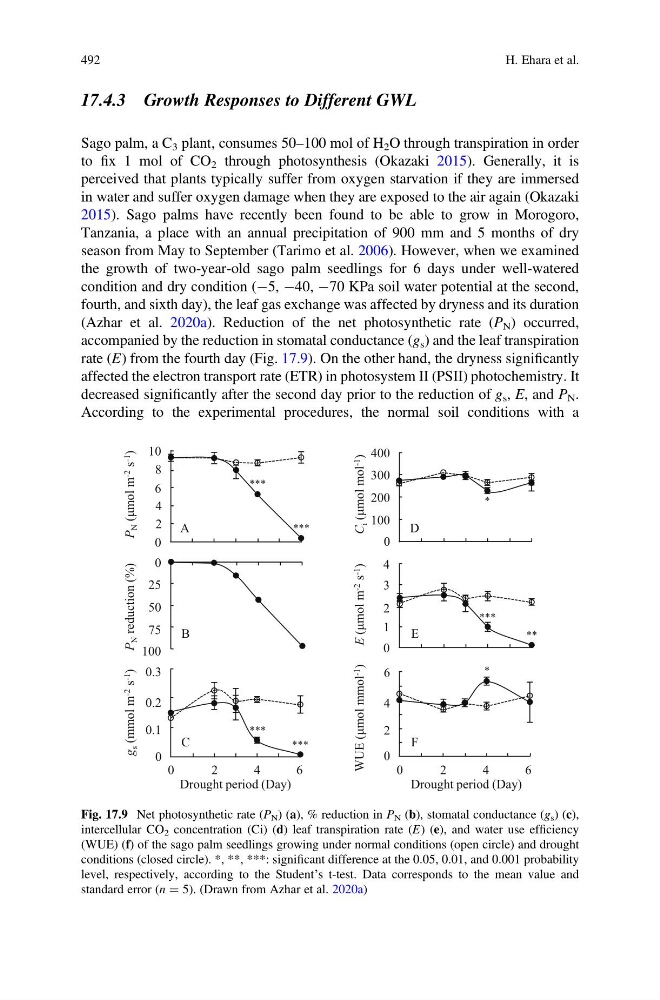
fourth, and sixth day), the leaf gas exchange was affected by dryness and its duration
(Azhar et al. 2020a). Reduction of the net photosynthetic rate (P N ) occurred,
accompanied by the reduction in stomatal conductance (g s ) and the leaf transpiration
rate (E) from the fourth day (Fig. 17.9). On the other hand, the dryness significantly
affected the electron transport rate (ETR) in photosystem II (PSII) photochemistry. It
decreased significantly after the second day prior to the reduction of g s , E, and P N .
According to the experimental procedures, the normal soil conditions with a
***
***
*
***
**
***
***
*
P
N (μmol m -2
s -1
)
P
N reduction (%)
g
s (mmol m -2
s -1
)
E (μmol
m -2
s -1
)
WUE (μmol mmol -1
)
Drought period (Day)
Drought period (Day)
4
0
8
0
2
6
4
2
6
10
0
2
6
4
200
0
400
100
300
C
i (μmol
mol -1
)
2
0
4
3
1
50
100
0
75
25
4
0
6
2
0.2
0
0.3
0.1
A
D
B
E
C
F
Fig. 17.9 Net photosynthetic rate (P N ) (a), % reduction in P N (b), stomatal conductance (g s ) (c),
intercellular CO 2 concentration (Ci) (d) leaf transpiration rate (E) (e), and water use efficiency
(WUE) (f) of the sago palm seedlings growing under normal conditions (open circle) and drought
conditions (closed circle). *, **, ***: significant difference at the 0.05, 0.01, and 0.001 probability
level, respectively, according to the Student’s t-test. Data corresponds to the mean value and
standard error (n ¼ 5). (Drawn from Azhar et al. 2020a)
492
H. Ehara et al.
Sago palm, a C 3 plant, consumes 50–100 mol of H 2 O through transpiration in order
to fix 1 mol of CO 2 through photosynthesis (Okazaki 2015). Generally, it is
perceived that plants typically suffer from oxygen starvation if they are immersed
in water and suffer oxygen damage when they are exposed to the air again (Okazaki
2015). Sago palms have recently been found to be able to grow in Morogoro,
Tanzania, a place with an annual precipitation of 900 mm and 5 months of dry
season from May to September (Tarimo et al. 2006). However, when we examined
the growth of two-year-old sago palm seedlings for 6 days under well-watered
condition and dry condition (À5, À40, À70 KPa soil water potential at the second,
fourth, and sixth day), the leaf gas exchange was affected by dryness and its duration
(Azhar et al. 2020a). Reduction of the net photosynthetic rate (P N ) occurred,
accompanied by the reduction in stomatal conductance (g s ) and the leaf transpiration
rate (E) from the fourth day (Fig. 17.9). On the other hand, the dryness significantly
affected the electron transport rate (ETR) in photosystem II (PSII) photochemistry. It
decreased significantly after the second day prior to the reduction of g s , E, and P N .
According to the experimental procedures, the normal soil conditions with a
***
***
*
***
**
***
***
*
P
N (μmol m -2
s -1
)
P
N reduction (%)
g
s (mmol m -2
s -1
)
E (μmol
m -2
s -1
)
WUE (μmol mmol -1
)
Drought period (Day)
Drought period (Day)
4
0
8
0
2
6
4
2
6
10
0
2
6
4
200
0
400
100
300
C
i (μmol
mol -1
)
2
0
4
3
1
50
100
0
75
25
4
0
6
2
0.2
0
0.3
0.1
A
D
B
E
C
F
Fig. 17.9 Net photosynthetic rate (P N ) (a), % reduction in P N (b), stomatal conductance (g s ) (c),
intercellular CO 2 concentration (Ci) (d) leaf transpiration rate (E) (e), and water use efficiency
(WUE) (f) of the sago palm seedlings growing under normal conditions (open circle) and drought
conditions (closed circle). *, **, ***: significant difference at the 0.05, 0.01, and 0.001 probability
level, respectively, according to the Student’s t-test. Data corresponds to the mean value and
standard error (n ¼ 5). (Drawn from Azhar et al. 2020a)
492
H. Ehara et al.