

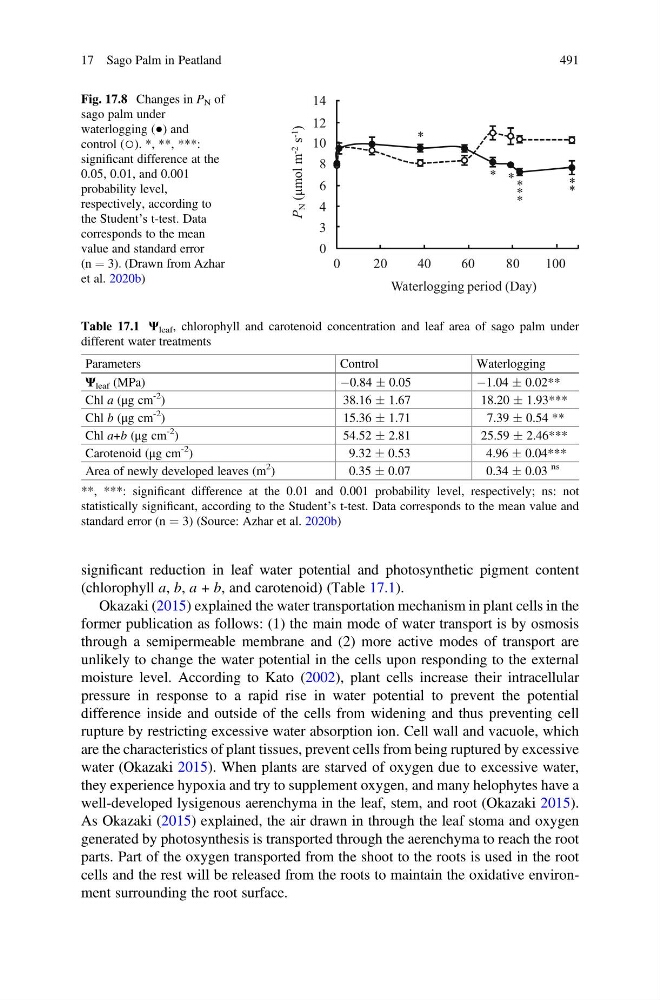
significant reduction in leaf water potential and photosynthetic pigment content
(chlorophyll a, b, a + b, and carotenoid) (Table 17.1).
Okazaki (2015) explained the water transportation mechanism in plant cells in the
former publication as follows: (1) the main mode of water transport is by osmosis
through a semipermeable membrane and (2) more active modes of transport are
unlikely to change the water potential in the cells upon responding to the external
moisture level. According to Kato (2002), plant cells increase their intracellular
pressure in response to a rapid rise in water potential to prevent the potential
difference inside and outside of the cells from widening and thus preventing cell
rupture by restricting excessive water absorption ion. Cell wall and vacuole, which
are the characteristics of plant tissues, prevent cells from being ruptured by excessive
water (Okazaki 2015). When plants are starved of oxygen due to excessive water,
they experience hypoxia and try to supplement oxygen, and many helophytes have a
well-developed lysigenous aerenchyma in the leaf, stem, and root (Okazaki 2015).
As Okazaki (2015) explained, the air drawn in through the leaf stoma and oxygen
generated by photosynthesis is transported through the aerenchyma to reach the root
parts. Part of the oxygen transported from the shoot to the roots is used in the root
cells and the rest will be released from the roots to maintain the oxidative environment surrounding the root surface.
14
4
0
8
P
N (μmol m -2
s -1
)
0
20
60
100
Waterlogging period (Day)
80
40
3
6
10
12
*
*
*
*
*
*
*
*
Fig. 17.8 Changes in P N of
sago palm under
waterlogging (●) and
control (○). *, **, ***:
significant difference at the
0.05, 0.01, and 0.001
probability level,
respectively, according to
the Student’s t-test. Data
corresponds to the mean
value and standard error
(n ¼ 3). (Drawn from Azhar
et al. 2020b)
Table 17.1 Ψ leaf , chlorophyll and carotenoid concentration and leaf area of sago palm under
different water treatments
Parameters
Control
Waterlogging
Ψ leaf (MPa)
À0.84 Æ 0.05
À1.04 Æ 0.02**
Chl a (μg cm
-2
)
38.16 Æ 1.67
18.20 Æ 1.93***
Chl b (μg cm
-2
)
15.36 Æ 1.71
7.39 Æ 0.54 **
Chl a+b (μg cm
-2
)
54.52 Æ 2.81
25.59 Æ 2.46***
Carotenoid (μg cm
-2
)
9.32 Æ 0.53
4.96 Æ 0.04***
Area of newly developed leaves (m
2
)
0.35 Æ 0.07
0.34 Æ 0.03
ns
**, ***: significant difference at the 0.01 and 0.001 probability level, respectively; ns: not
statistically significant, according to the Student’s t-test. Data corresponds to the mean value and
standard error (n ¼ 3) (Source: Azhar et al. 2020b)
17 Sago Palm in Peatland
491
(chlorophyll a, b, a + b, and carotenoid) (Table 17.1).
Okazaki (2015) explained the water transportation mechanism in plant cells in the
former publication as follows: (1) the main mode of water transport is by osmosis
through a semipermeable membrane and (2) more active modes of transport are
unlikely to change the water potential in the cells upon responding to the external
moisture level. According to Kato (2002), plant cells increase their intracellular
pressure in response to a rapid rise in water potential to prevent the potential
difference inside and outside of the cells from widening and thus preventing cell
rupture by restricting excessive water absorption ion. Cell wall and vacuole, which
are the characteristics of plant tissues, prevent cells from being ruptured by excessive
water (Okazaki 2015). When plants are starved of oxygen due to excessive water,
they experience hypoxia and try to supplement oxygen, and many helophytes have a
well-developed lysigenous aerenchyma in the leaf, stem, and root (Okazaki 2015).
As Okazaki (2015) explained, the air drawn in through the leaf stoma and oxygen
generated by photosynthesis is transported through the aerenchyma to reach the root
parts. Part of the oxygen transported from the shoot to the roots is used in the root
cells and the rest will be released from the roots to maintain the oxidative environment surrounding the root surface.
14
4
0
8
P
N (μmol m -2
s -1
)
0
20
60
100
Waterlogging period (Day)
80
40
3
6
10
12
*
*
*
*
*
*
*
*
Fig. 17.8 Changes in P N of
sago palm under
waterlogging (●) and
control (○). *, **, ***:
significant difference at the
0.05, 0.01, and 0.001
probability level,
respectively, according to
the Student’s t-test. Data
corresponds to the mean
value and standard error
(n ¼ 3). (Drawn from Azhar
et al. 2020b)
Table 17.1 Ψ leaf , chlorophyll and carotenoid concentration and leaf area of sago palm under
different water treatments
Parameters
Control
Waterlogging
Ψ leaf (MPa)
À0.84 Æ 0.05
À1.04 Æ 0.02**
Chl a (μg cm
-2
)
38.16 Æ 1.67
18.20 Æ 1.93***
Chl b (μg cm
-2
)
15.36 Æ 1.71
7.39 Æ 0.54 **
Chl a+b (μg cm
-2
)
54.52 Æ 2.81
25.59 Æ 2.46***
Carotenoid (μg cm
-2
)
9.32 Æ 0.53
4.96 Æ 0.04***
Area of newly developed leaves (m
2
)
0.35 Æ 0.07
0.34 Æ 0.03
ns
**, ***: significant difference at the 0.01 and 0.001 probability level, respectively; ns: not
statistically significant, according to the Student’s t-test. Data corresponds to the mean value and
standard error (n ¼ 3) (Source: Azhar et al. 2020b)
17 Sago Palm in Peatland
491