

The result of the survey also found that around 97% of the total 149,800 ha was
peat soil, while the other was mineral soil, located in the most northern part (heath
forest) and the most southern part (coastal forest). Peat depth in the project area is
categorized into 7 thickness class, where peat thickness estimated <2 m was 4%;
2–4 m was 11%; 4–6 m was 28%; 6–8 m was 41%; 8–10 m was 14%; 10–12 m was
1%; and more than 12 m was 1% (see Fig. 13.1). The peat soil is mostly thicker in the
center of the area (in the middle of two watersheds) forming the dome-shaped peat
topography. Underneath the peat layer, there are two geological soil formations. The
one stretching from north to south over the eastern part is made up of alluvial
deposits, while the other in the north-western part is predominantly by Dahor
Formations consisting of quartz sandstone, lignite, and soft limonite clay (Siran
et al. 2012).
13.2.2 Peat Properties
In terms of the peat properties, during the 2011–2013 period, several peat analyses
such as bulk density, ash content, and carbon content have been conducted. The
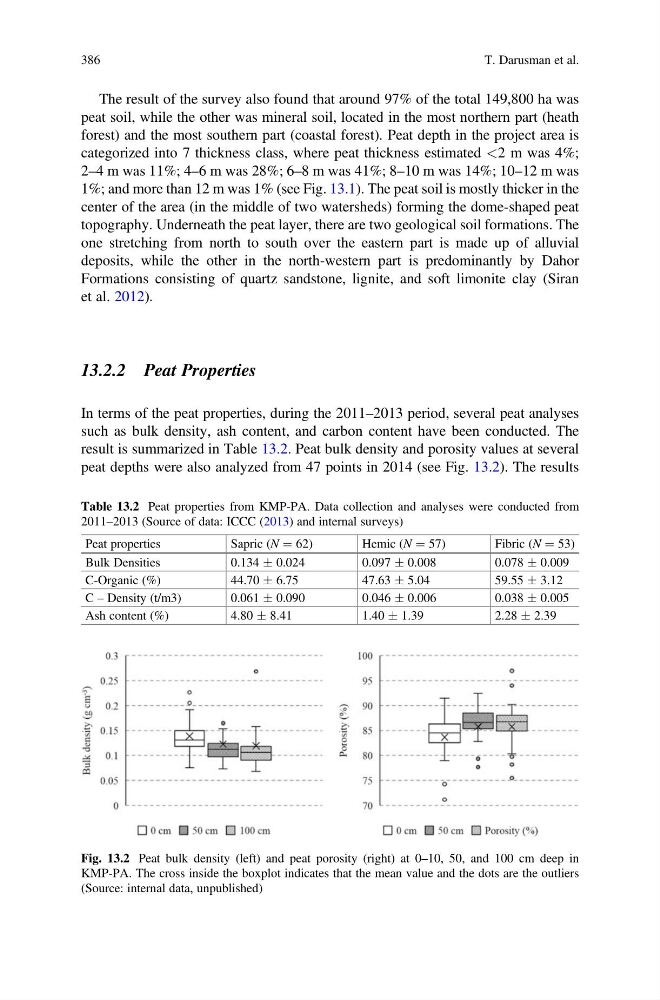
result is summarized in Table 13.2. Peat bulk density and porosity values at several
peat depths were also analyzed from 47 points in 2014 (see Fig. 13.2). The results
Table 13.2 Peat properties from KMP-PA. Data collection and analyses were conducted from
2011–2013 (Source of data: ICCC (2013) and internal surveys)
Peat properties
Sapric (N ¼ 62)
Hemic (N ¼ 57)
Fibric (N ¼ 53)
Bulk Densities
0.134 Æ 0.024
0.097 Æ 0.008
0.078 Æ 0.009
C-Organic (%)
44.70 Æ 6.75
47.63 Æ 5.04
59.55 Æ 3.12
C – Density (t/m3)
0.061 Æ 0.090
0.046 Æ 0.006
0.038 Æ 0.005
Ash content (%)
4.80 Æ 8.41
1.40 Æ 1.39
2.28 Æ 2.39
Fig. 13.2 Peat bulk density (left) and peat porosity (right) at 0–10, 50, and 100 cm deep in
KMP-PA. The cross inside the boxplot indicates that the mean value and the dots are the outliers
(Source: internal data, unpublished)
386
T. Darusman et al.
peat soil, while the other was mineral soil, located in the most northern part (heath
forest) and the most southern part (coastal forest). Peat depth in the project area is
categorized into 7 thickness class, where peat thickness estimated <2 m was 4%;
2–4 m was 11%; 4–6 m was 28%; 6–8 m was 41%; 8–10 m was 14%; 10–12 m was
1%; and more than 12 m was 1% (see Fig. 13.1). The peat soil is mostly thicker in the
center of the area (in the middle of two watersheds) forming the dome-shaped peat
topography. Underneath the peat layer, there are two geological soil formations. The
one stretching from north to south over the eastern part is made up of alluvial
deposits, while the other in the north-western part is predominantly by Dahor
Formations consisting of quartz sandstone, lignite, and soft limonite clay (Siran
et al. 2012).
13.2.2 Peat Properties
In terms of the peat properties, during the 2011–2013 period, several peat analyses
such as bulk density, ash content, and carbon content have been conducted. The
result is summarized in Table 13.2. Peat bulk density and porosity values at several
peat depths were also analyzed from 47 points in 2014 (see Fig. 13.2). The results
Table 13.2 Peat properties from KMP-PA. Data collection and analyses were conducted from
2011–2013 (Source of data: ICCC (2013) and internal surveys)
Peat properties
Sapric (N ¼ 62)
Hemic (N ¼ 57)
Fibric (N ¼ 53)
Bulk Densities
0.134 Æ 0.024
0.097 Æ 0.008
0.078 Æ 0.009
C-Organic (%)
44.70 Æ 6.75
47.63 Æ 5.04
59.55 Æ 3.12
C – Density (t/m3)
0.061 Æ 0.090
0.046 Æ 0.006
0.038 Æ 0.005
Ash content (%)
4.80 Æ 8.41
1.40 Æ 1.39
2.28 Æ 2.39
Fig. 13.2 Peat bulk density (left) and peat porosity (right) at 0–10, 50, and 100 cm deep in
KMP-PA. The cross inside the boxplot indicates that the mean value and the dots are the outliers
(Source: internal data, unpublished)
386
T. Darusman et al.