

600
K. Kleinknecht and U. Uwer
10 3
10 2
10
1
10 4
LHCb
10 –1
5
1 0
Decay time [ps]
Candidates / (0.2 ps)
3000
2500
2000
1500
1000
500
3500
LHCb
0
0
–0.5
–1
0.5
1
cos K
Candidates / 0.05
3000
2500
2000
1500
1000
500
3500
LHCb
0
0
–0.5
–1
0.5
1
cos
Candidates / 0.05
3000
2500
2000
1500
1000
500
3500
LHCb
0
0
–2
2
Candidates / (0.05 rad)
h
[rad]
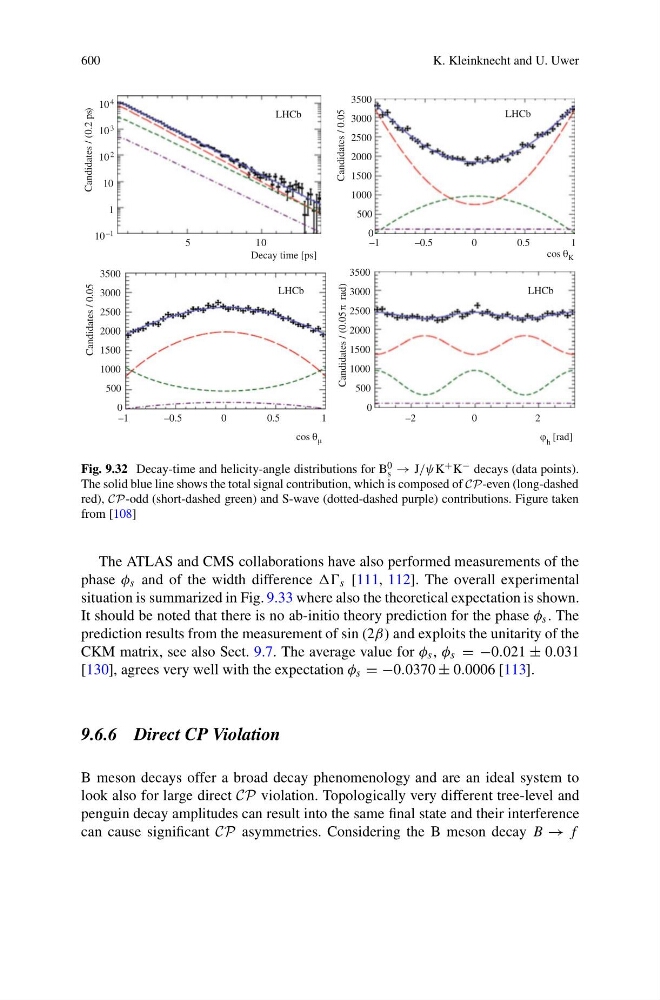
Fig. 9.32 Decay-time and helicity-angle distributions for B 0
s → J/ψK + K − decays (data points).
The solid blue line shows the total signal contribution, which is composed of CP-even (long-dashed
red), CP-odd (short-dashed green) and S-wave (dotted-dashed purple) contributions. Figure taken
from [108]
The ATLAS and CMS collaborations have also performed measurements of the
phase φ s and of the width difference s [111, 112]. The overall experimental
situation is summarized in Fig. 9.33 where also the theoretical expectation is shown.
It should be noted that there is no ab-initio theory prediction for the phase φ s . The
prediction results from the measurement of sin (2β) and exploits the unitarity of the
CKM matrix, see also Sect. 9.7. The average value for φ s , φ s = −0.021 ± 0.031
[130], agrees very well with the expectation φ s = −0.0370 ± 0.0006 [113].
9.6.6 Direct CP Violation
B meson decays offer a broad decay phenomenology and are an ideal system to
look also for large direct CP violation. Topologically very different tree-level and
penguin decay amplitudes can result into the same final state and their interference
can cause significant CP asymmetries. Considering the B meson decay B → f
K. Kleinknecht and U. Uwer
10 3
10 2
10
1
10 4
LHCb
10 –1
5
1 0
Decay time [ps]
Candidates / (0.2 ps)
3000
2500
2000
1500
1000
500
3500
LHCb
0
0
–0.5
–1
0.5
1
cos K
Candidates / 0.05
3000
2500
2000
1500
1000
500
3500
LHCb
0
0
–0.5
–1
0.5
1
cos
Candidates / 0.05
3000
2500
2000
1500
1000
500
3500
LHCb
0
0
–2
2
Candidates / (0.05 rad)
h
[rad]
Fig. 9.32 Decay-time and helicity-angle distributions for B 0
s → J/ψK + K − decays (data points).
The solid blue line shows the total signal contribution, which is composed of CP-even (long-dashed
red), CP-odd (short-dashed green) and S-wave (dotted-dashed purple) contributions. Figure taken
from [108]
The ATLAS and CMS collaborations have also performed measurements of the
phase φ s and of the width difference s [111, 112]. The overall experimental
situation is summarized in Fig. 9.33 where also the theoretical expectation is shown.
It should be noted that there is no ab-initio theory prediction for the phase φ s . The
prediction results from the measurement of sin (2β) and exploits the unitarity of the
CKM matrix, see also Sect. 9.7. The average value for φ s , φ s = −0.021 ± 0.031
[130], agrees very well with the expectation φ s = −0.0370 ± 0.0006 [113].
9.6.6 Direct CP Violation
B meson decays offer a broad decay phenomenology and are an ideal system to
look also for large direct CP violation. Topologically very different tree-level and
penguin decay amplitudes can result into the same final state and their interference
can cause significant CP asymmetries. Considering the B meson decay B → f