

594
K. Kleinknecht and U. Uwer
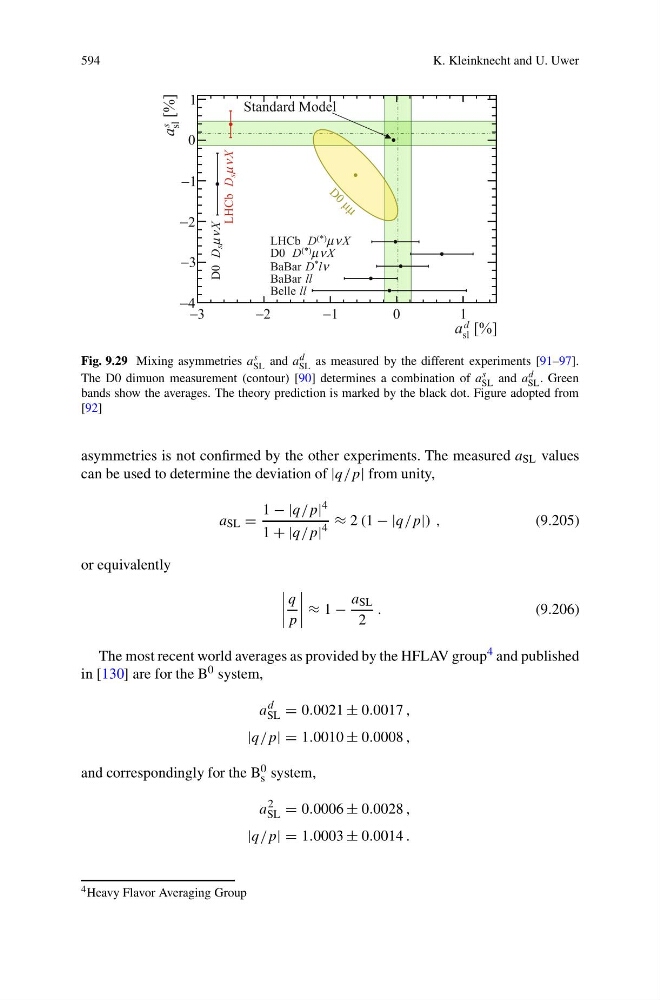
Fig. 9.29 Mixing asymmetries a s
SL and a d
SL as measured by the different experiments [91–97].
The D0 dimuon measurement (contour) [90] determines a combination of a
s
SL and a
d
SL . Green
bands show the averages. The theory prediction is marked by the black dot. Figure adopted from
[92]
asymmetries is not confirmed by the other experiments. The measured a SL values
can be used to determine the deviation of |q/p| from unity,
a SL =
1 − |q/p| 4
1 + |q/p| 4 ≈ 2 (1 − |q/p|) ,
(9.205)
or equivalently
q
p
≈ 1 −
a SL
2
.
(9.206)
The most recent world averages as provided by the HFLAV group 4 and published
in [130] are for the B 0 system,
a
d
SL = 0.0021 ± 0.0017 ,
|q/p| = 1.0010 ± 0.0008 ,
and correspondingly for the B 0
s system,
a
2
SL = 0.0006 ± 0.0028 ,
|q/p| = 1.0003 ± 0.0014 .
4 Heavy Flavor Averaging Group
K. Kleinknecht and U. Uwer
Fig. 9.29 Mixing asymmetries a s
SL and a d
SL as measured by the different experiments [91–97].
The D0 dimuon measurement (contour) [90] determines a combination of a
s
SL and a
d
SL . Green
bands show the averages. The theory prediction is marked by the black dot. Figure adopted from
[92]
asymmetries is not confirmed by the other experiments. The measured a SL values
can be used to determine the deviation of |q/p| from unity,
a SL =
1 − |q/p| 4
1 + |q/p| 4 ≈ 2 (1 − |q/p|) ,
(9.205)
or equivalently
q
p
≈ 1 −
a SL
2
.
(9.206)
The most recent world averages as provided by the HFLAV group 4 and published
in [130] are for the B 0 system,
a
d
SL = 0.0021 ± 0.0017 ,
|q/p| = 1.0010 ± 0.0008 ,
and correspondingly for the B 0
s system,
a
2
SL = 0.0006 ± 0.0028 ,
|q/p| = 1.0003 ± 0.0014 .
4 Heavy Flavor Averaging Group