

574
K. Kleinknecht and U. Uwer
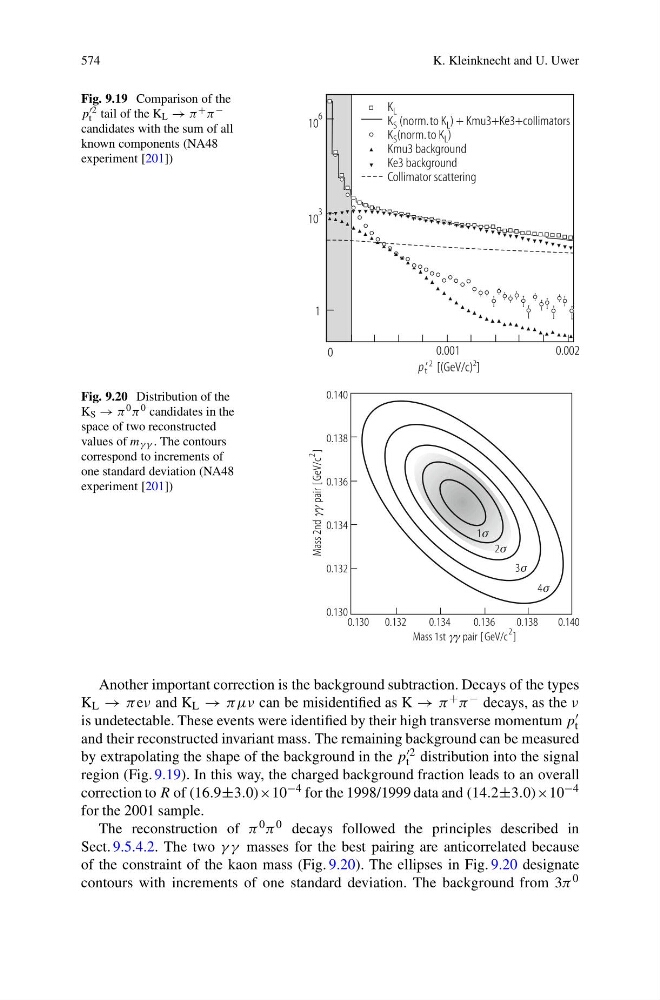
Fig. 9.19 Comparison of the
p 2
t tail of the K L → π + π −
candidates with the sum of all
known components (NA48
experiment [201])
Fig. 9.20 Distribution of the
K S → π 0 π 0 candidates in the
space of two reconstructed
values of m γ γ . The contours
correspond to increments of
one standard deviation (NA48
experiment [201])
Another important correction is the background subtraction. Decays of the types
K L → πeν and K L → πμν can be misidentified as K → π + π − decays, as the ν
is undetectable. These events were identified by their high transverse momentum p
t
and their reconstructed invariant mass. The remaining background can be measured
by extrapolating the shape of the background in the p 2
t distribution into the signal
region (Fig. 9.19). In this way, the charged background fraction leads to an overall
correction to R of (16.9±3.0)×10 −4 for the 1998/1999 data and (14.2±3.0)×10 −4
for the 2001 sample.
The reconstruction of π 0 π 0 decays followed the principles described in
Sect. 9.5.4.2. The two γ γ masses for the best pairing are anticorrelated because
of the constraint of the kaon mass (Fig. 9.20). The ellipses in Fig. 9.20 designate
contours with increments of one standard deviation. The background from 3π 0
K. Kleinknecht and U. Uwer
Fig. 9.19 Comparison of the
p 2
t tail of the K L → π + π −
candidates with the sum of all
known components (NA48
experiment [201])
Fig. 9.20 Distribution of the
K S → π 0 π 0 candidates in the
space of two reconstructed
values of m γ γ . The contours
correspond to increments of
one standard deviation (NA48
experiment [201])
Another important correction is the background subtraction. Decays of the types
K L → πeν and K L → πμν can be misidentified as K → π + π − decays, as the ν
is undetectable. These events were identified by their high transverse momentum p
t
and their reconstructed invariant mass. The remaining background can be measured
by extrapolating the shape of the background in the p 2
t distribution into the signal
region (Fig. 9.19). In this way, the charged background fraction leads to an overall
correction to R of (16.9±3.0)×10 −4 for the 1998/1999 data and (14.2±3.0)×10 −4
for the 2001 sample.
The reconstruction of π 0 π 0 decays followed the principles described in
Sect. 9.5.4.2. The two γ γ masses for the best pairing are anticorrelated because
of the constraint of the kaon mass (Fig. 9.20). The ellipses in Fig. 9.20 designate
contours with increments of one standard deviation. The background from 3π 0