

9 Symmetry Violations and Quark Flavour Physics
573
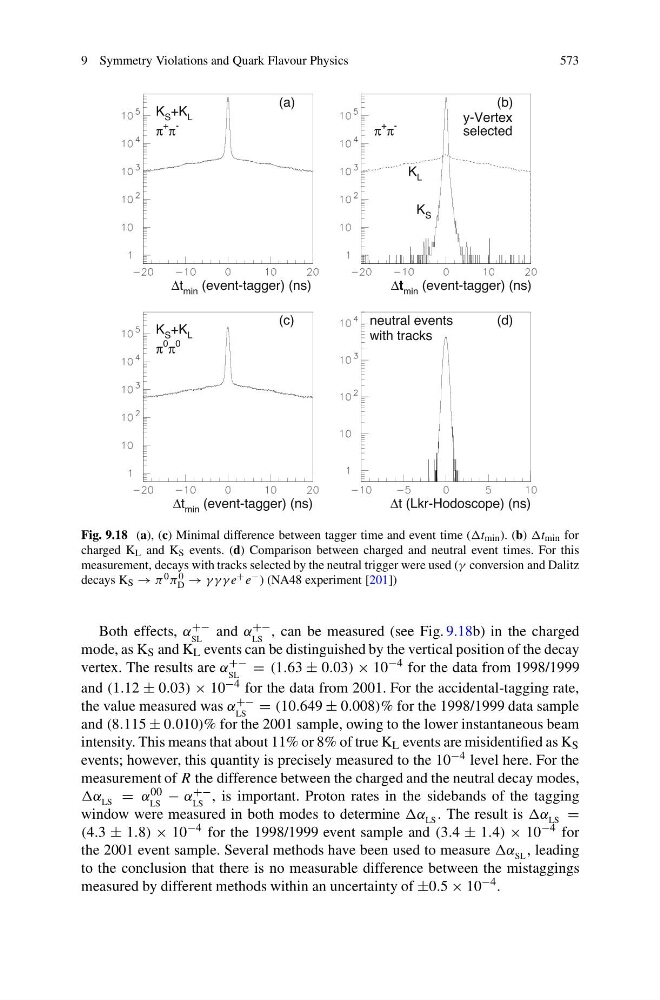
Fig. 9.18 (a), (c) Minimal difference between tagger time and event time (t min ). (b) t min for
charged K L and K S events. (d) Comparison between charged and neutral event times. For this
measurement, decays with tracks selected by the neutral trigger were used (γ conversion and Dalitz
decays K S → π 0 π 0
D → γ γ γ e + e − ) (NA48 experiment [201])
Both effects, α +−
SL
and α +−
LS
, can be measured (see Fig. 9.18b) in the charged
mode, as K S and K L events can be distinguished by the vertical position of the decay
vertex. The results are α +−
SL
= (1.63 ± 0.03) × 10 −4 for the data from 1998/1999
and (1.12 ± 0.03) × 10 −4 for the data from 2001. For the accidental-tagging rate,
the value measured was α +−
LS
= (10.649 ± 0.008)% for the 1998/1999 data sample
and (8.115 ± 0.010)% for the 2001 sample, owing to the lower instantaneous beam
intensity. This means that about 11% or 8% of true K L events are misidentified as K S
events; however, this quantity is precisely measured to the 10 −4 level here. For the
measurement of R the difference between the charged and the neutral decay modes,
α LS = α 00
LS
− α +−
LS
, is important. Proton rates in the sidebands of the tagging
window were measured in both modes to determine α LS . The result is α LS =
(4.3 ± 1.8) × 10 −4 for the 1998/1999 event sample and (3.4 ± 1.4) × 10 −4 for
the 2001 event sample. Several methods have been used to measure α SL , leading
to the conclusion that there is no measurable difference between the mistaggings
measured by different methods within an uncertainty of ±0.5 × 10 −4 .
573
Fig. 9.18 (a), (c) Minimal difference between tagger time and event time (t min ). (b) t min for
charged K L and K S events. (d) Comparison between charged and neutral event times. For this
measurement, decays with tracks selected by the neutral trigger were used (γ conversion and Dalitz
decays K S → π 0 π 0
D → γ γ γ e + e − ) (NA48 experiment [201])
Both effects, α +−
SL
and α +−
LS
, can be measured (see Fig. 9.18b) in the charged
mode, as K S and K L events can be distinguished by the vertical position of the decay
vertex. The results are α +−
SL
= (1.63 ± 0.03) × 10 −4 for the data from 1998/1999
and (1.12 ± 0.03) × 10 −4 for the data from 2001. For the accidental-tagging rate,
the value measured was α +−
LS
= (10.649 ± 0.008)% for the 1998/1999 data sample
and (8.115 ± 0.010)% for the 2001 sample, owing to the lower instantaneous beam
intensity. This means that about 11% or 8% of true K L events are misidentified as K S
events; however, this quantity is precisely measured to the 10 −4 level here. For the
measurement of R the difference between the charged and the neutral decay modes,
α LS = α 00
LS
− α +−
LS
, is important. Proton rates in the sidebands of the tagging
window were measured in both modes to determine α LS . The result is α LS =
(4.3 ± 1.8) × 10 −4 for the 1998/1999 event sample and (3.4 ± 1.4) × 10 −4 for
the 2001 event sample. Several methods have been used to measure α SL , leading
to the conclusion that there is no measurable difference between the mistaggings
measured by different methods within an uncertainty of ±0.5 × 10 −4 .