

572
K. Kleinknecht and U. Uwer
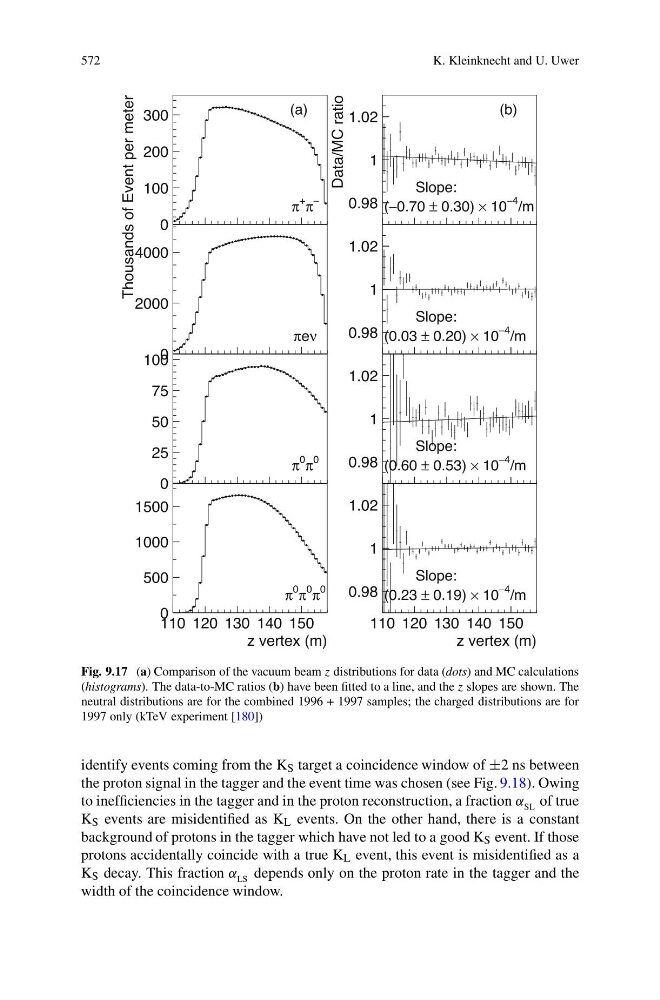
Fig. 9.17 (a) Comparison of the vacuum beam z distributions for data (dots) and MC calculations
(histograms). The data-to-MC ratios (b) have been fitted to a line, and the z slopes are shown. The
neutral distributions are for the combined 1996 + 1997 samples; the charged distributions are for
1997 only (kTeV experiment [180])
identify events coming from the K S target a coincidence window of ±2 ns between
the proton signal in the tagger and the event time was chosen (see Fig. 9.18). Owing
to inefficiencies in the tagger and in the proton reconstruction, a fraction α SL of true
K S events are misidentified as K L events. On the other hand, there is a constant
background of protons in the tagger which have not led to a good K S event. If those
protons accidentally coincide with a true K L event, this event is misidentified as a
K S decay. This fraction α LS depends only on the proton rate in the tagger and the
width of the coincidence window.
K. Kleinknecht and U. Uwer
Fig. 9.17 (a) Comparison of the vacuum beam z distributions for data (dots) and MC calculations
(histograms). The data-to-MC ratios (b) have been fitted to a line, and the z slopes are shown. The
neutral distributions are for the combined 1996 + 1997 samples; the charged distributions are for
1997 only (kTeV experiment [180])
identify events coming from the K S target a coincidence window of ±2 ns between
the proton signal in the tagger and the event time was chosen (see Fig. 9.18). Owing
to inefficiencies in the tagger and in the proton reconstruction, a fraction α SL of true
K S events are misidentified as K L events. On the other hand, there is a constant
background of protons in the tagger which have not led to a good K S event. If those
protons accidentally coincide with a true K L event, this event is misidentified as a
K S decay. This fraction α LS depends only on the proton rate in the tagger and the
width of the coincidence window.