

9 Symmetry Violations and Quark Flavour Physics
571
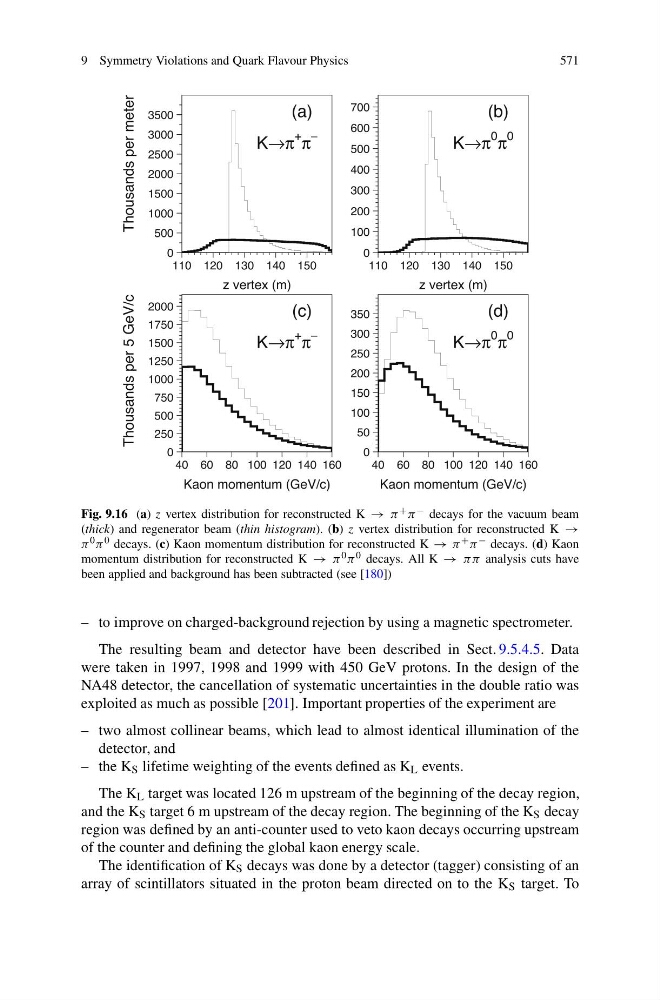
Fig. 9.16 (a) z vertex distribution for reconstructed K → π + π − decays for the vacuum beam
(thick) and regenerator beam (thin histogram). (b) z vertex distribution for reconstructed K →
π 0 π 0 decays. (c) Kaon momentum distribution for reconstructed K → π + π − decays. (d) Kaon
momentum distribution for reconstructed K → π 0 π 0 decays. All K → ππ analysis cuts have
been applied and background has been subtracted (see [180])
– to improve on charged-background rejection by using a magnetic spectrometer.
The resulting beam and detector have been described in Sect. 9.5.4.5. Data
were taken in 1997, 1998 and 1999 with 450 GeV protons. In the design of the
NA48 detector, the cancellation of systematic uncertainties in the double ratio was
exploited as much as possible [201]. Important properties of the experiment are
– two almost collinear beams, which lead to almost identical illumination of the
detector, and
– the K S lifetime weighting of the events defined as K L events.
The K L target was located 126 m upstream of the beginning of the decay region,
and the K S target 6 m upstream of the decay region. The beginning of the K S decay
region was defined by an anti-counter used to veto kaon decays occurring upstream
of the counter and defining the global kaon energy scale.
The identification of K S decays was done by a detector (tagger) consisting of an
array of scintillators situated in the proton beam directed on to the K S target. To
571
Fig. 9.16 (a) z vertex distribution for reconstructed K → π + π − decays for the vacuum beam
(thick) and regenerator beam (thin histogram). (b) z vertex distribution for reconstructed K →
π 0 π 0 decays. (c) Kaon momentum distribution for reconstructed K → π + π − decays. (d) Kaon
momentum distribution for reconstructed K → π 0 π 0 decays. All K → ππ analysis cuts have
been applied and background has been subtracted (see [180])
– to improve on charged-background rejection by using a magnetic spectrometer.
The resulting beam and detector have been described in Sect. 9.5.4.5. Data
were taken in 1997, 1998 and 1999 with 450 GeV protons. In the design of the
NA48 detector, the cancellation of systematic uncertainties in the double ratio was
exploited as much as possible [201]. Important properties of the experiment are
– two almost collinear beams, which lead to almost identical illumination of the
detector, and
– the K S lifetime weighting of the events defined as K L events.
The K L target was located 126 m upstream of the beginning of the decay region,
and the K S target 6 m upstream of the decay region. The beginning of the K S decay
region was defined by an anti-counter used to veto kaon decays occurring upstream
of the counter and defining the global kaon energy scale.
The identification of K S decays was done by a detector (tagger) consisting of an
array of scintillators situated in the proton beam directed on to the K S target. To