

7 Relativistic Nucleus-Nucleus Collisions and the QCD Matter Phase Diagram
417
where M pairs is the total number of track pairs of the events k contained in the entire
ensemble of n events, N(k) is the number of tracks in event k, and p T i = p T i −p T
where p T is the global ensemble mean p T . The normalized dynamical fluctuation is
then expressed [281] as
σ (p T ) dyn =
p T i p Tj
/ p T .
(7.81)
It is zero for uncorrelated particle emission.
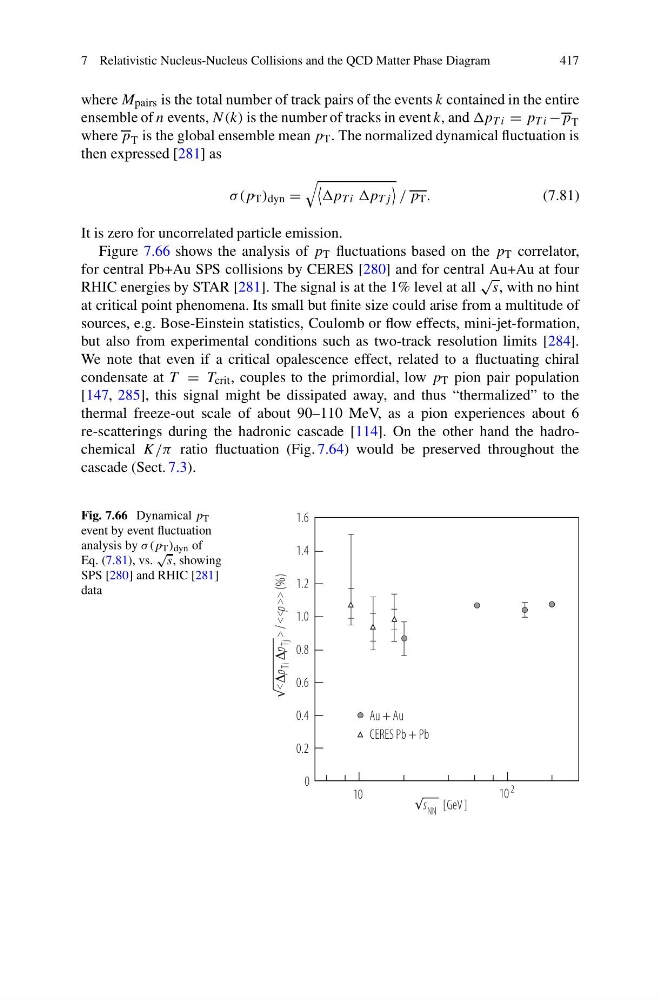
Figure 7.66 shows the analysis of p T fluctuations based on the p T correlator,
for central Pb+Au SPS collisions by CERES [280] and for central Au+Au at four
RHIC energies by STAR [281]. The signal is at the 1% level at all
√
s, with no hint
at critical point phenomena. Its small but finite size could arise from a multitude of
sources, e.g. Bose-Einstein statistics, Coulomb or flow effects, mini-jet-formation,
but also from experimental conditions such as two-track resolution limits [284].
We note that even if a critical opalescence effect, related to a fluctuating chiral
condensate at T = T crit , couples to the primordial, low p T pion pair population
[147, 285], this signal might be dissipated away, and thus “thermalized” to the
thermal freeze-out scale of about 90–110 MeV, as a pion experiences about 6
re-scatterings during the hadronic cascade [114]. On the other hand the hadrochemical K/π ratio fluctuation (Fig. 7.64) would be preserved throughout the
cascade (Sect. 7.3).
Fig. 7.66 Dynamical p T
event by event fluctuation
analysis by σ (p T ) dyn of
Eq. (7.81), vs.
√
s, showing
SPS [280] and RHIC [281]
data
1.6
1.4
1.2
1.0
0.8
0.6
0.4
0.2
0
10
10
2
s NN [GeV]
<
j
T
i
T
>
>
<
<
>
p
p
p )
%
(
/
Au + Au
CERES Pb + Pb
417
where M pairs is the total number of track pairs of the events k contained in the entire
ensemble of n events, N(k) is the number of tracks in event k, and p T i = p T i −p T
where p T is the global ensemble mean p T . The normalized dynamical fluctuation is
then expressed [281] as
σ (p T ) dyn =
p T i p Tj
/ p T .
(7.81)
It is zero for uncorrelated particle emission.
Figure 7.66 shows the analysis of p T fluctuations based on the p T correlator,
for central Pb+Au SPS collisions by CERES [280] and for central Au+Au at four
RHIC energies by STAR [281]. The signal is at the 1% level at all
√
s, with no hint
at critical point phenomena. Its small but finite size could arise from a multitude of
sources, e.g. Bose-Einstein statistics, Coulomb or flow effects, mini-jet-formation,
but also from experimental conditions such as two-track resolution limits [284].
We note that even if a critical opalescence effect, related to a fluctuating chiral
condensate at T = T crit , couples to the primordial, low p T pion pair population
[147, 285], this signal might be dissipated away, and thus “thermalized” to the
thermal freeze-out scale of about 90–110 MeV, as a pion experiences about 6
re-scatterings during the hadronic cascade [114]. On the other hand the hadrochemical K/π ratio fluctuation (Fig. 7.64) would be preserved throughout the
cascade (Sect. 7.3).
Fig. 7.66 Dynamical p T
event by event fluctuation
analysis by σ (p T ) dyn of
Eq. (7.81), vs.
√
s, showing
SPS [280] and RHIC [281]
data
1.6
1.4
1.2
1.0
0.8
0.6
0.4
0.2
0
10
10
2
s NN [GeV]
<
j
T
i
T
>
>
<
<
>
p
p
p )
%
(
/
Au + Au
CERES Pb + Pb