

416
R. Stock
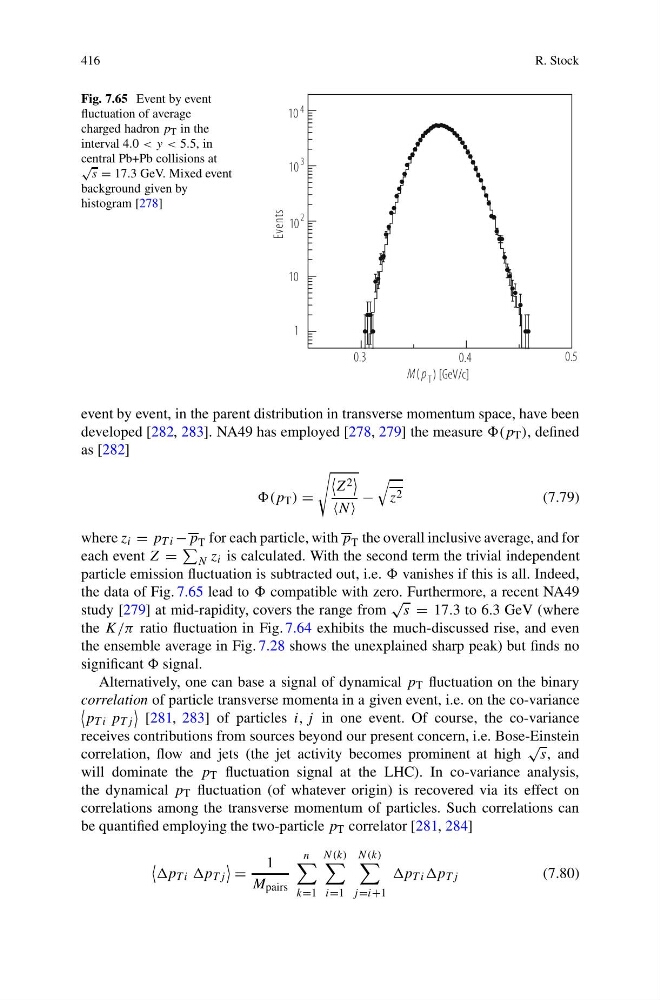
Fig. 7.65 Event by event
fluctuation of average
charged hadron p T in the
interval 4.0 < y < 5.5, in
central Pb+Pb collisions at
√
s = 17.3 GeV. Mixed event
background given by
histogram [278]
M p
( T ) [GeV/c]
0.3
0.4
0.5
s
t
n
e
v
E
1
10
10
2
10
3
10 4
event by event, in the parent distribution in transverse momentum space, have been
developed [282, 283]. NA49 has employed [278, 279] the measure (p T ), defined
as [282]
(p T ) =
Z 2
N
−
z 2
(7.79)
where z i = p T i −p T for each particle, with p T the overall inclusive average, and for
each event Z =
N z i is calculated. With the second term the trivial independent
particle emission fluctuation is subtracted out, i.e. vanishes if this is all. Indeed,
the data of Fig. 7.65 lead to compatible with zero. Furthermore, a recent NA49
study [279] at mid-rapidity, covers the range from
√
s = 17.3 to 6.3 GeV (where
the K/π ratio fluctuation in Fig. 7.64 exhibits the much-discussed rise, and even
the ensemble average in Fig. 7.28 shows the unexplained sharp peak) but finds no
significant signal.
Alternatively, one can base a signal of dynamical p T fluctuation on the binary
correlation of particle transverse momenta in a given event, i.e. on the co-variance
p T i p Tj
[281, 283] of particles i, j in one event. Of course, the co-variance
receives contributions from sources beyond our present concern, i.e. Bose-Einstein
correlation, flow and jets (the jet activity becomes prominent at high
√
s, and
will dominate the p T fluctuation signal at the LHC). In co-variance analysis,
the dynamical p T fluctuation (of whatever origin) is recovered via its effect on
correlations among the transverse momentum of particles. Such correlations can
be quantified employing the two-particle p T correlator [281, 284]
p T i p Tj
=
1
M pairs
n
k=1
N(k)
i=1
N(k)
j =i+1
p T i p Tj
(7.80)
R. Stock
Fig. 7.65 Event by event
fluctuation of average
charged hadron p T in the
interval 4.0 < y < 5.5, in
central Pb+Pb collisions at
√
s = 17.3 GeV. Mixed event
background given by
histogram [278]
M p
( T ) [GeV/c]
0.3
0.4
0.5
s
t
n
e
v
E
1
10
10
2
10
3
10 4
event by event, in the parent distribution in transverse momentum space, have been
developed [282, 283]. NA49 has employed [278, 279] the measure (p T ), defined
as [282]
(p T ) =
Z 2
N
−
z 2
(7.79)
where z i = p T i −p T for each particle, with p T the overall inclusive average, and for
each event Z =
N z i is calculated. With the second term the trivial independent
particle emission fluctuation is subtracted out, i.e. vanishes if this is all. Indeed,
the data of Fig. 7.65 lead to compatible with zero. Furthermore, a recent NA49
study [279] at mid-rapidity, covers the range from
√
s = 17.3 to 6.3 GeV (where
the K/π ratio fluctuation in Fig. 7.64 exhibits the much-discussed rise, and even
the ensemble average in Fig. 7.28 shows the unexplained sharp peak) but finds no
significant signal.
Alternatively, one can base a signal of dynamical p T fluctuation on the binary
correlation of particle transverse momenta in a given event, i.e. on the co-variance
p T i p Tj
[281, 283] of particles i, j in one event. Of course, the co-variance
receives contributions from sources beyond our present concern, i.e. Bose-Einstein
correlation, flow and jets (the jet activity becomes prominent at high
√
s, and
will dominate the p T fluctuation signal at the LHC). In co-variance analysis,
the dynamical p T fluctuation (of whatever origin) is recovered via its effect on
correlations among the transverse momentum of particles. Such correlations can
be quantified employing the two-particle p T correlator [281, 284]
p T i p Tj
=
1
M pairs
n
k=1
N(k)
i=1
N(k)
j =i+1
p T i p Tj
(7.80)