

7 Relativistic Nucleus-Nucleus Collisions and the QCD Matter Phase Diagram
373
is positioned at y = 0. The obvious geometrical deformation can be quantified by
the spatial excentricity (unfortunately also labeled in the literature)
x (b) =
y 2 − x 2
y 2 + x 2
(7.47)
where the averages are taken with respect to the transverse density profiles of
Fig. 7.34. x is zero for b = 0, reaching a value of about 0.3 in the case b = 7 fm
illustrated in Fig. 7.34.
Translated into the initialization of the hydrodynamic expansion the density
anisotropy implies a corresponding pressure anisotropy. The pressure is higher in
x than in y direction, and thus is the initial acceleration, leading to an increasing
momentum anisotropy,
p (τ ) =
dx dy (T xx − T yy )
dx dy (T xx + T yy )
(7.48)
where T
μx
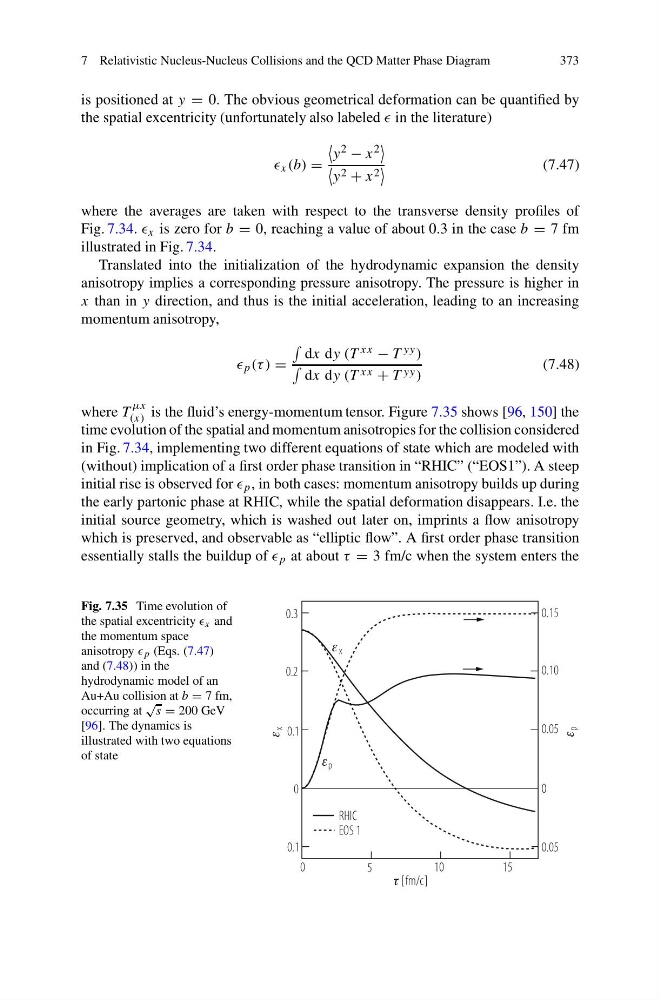
(x) is the fluid’s energy-momentum tensor. Figure 7.35 shows [96, 150] the
time evolution of the spatial and momentum anisotropies for the collision considered
in Fig. 7.34, implementing two different equations of state which are modeled with
(without) implication of a first order phase transition in “RHIC” (“EOS1”). A steep
initial rise is observed for p , in both cases: momentum anisotropy builds up during
the early partonic phase at RHIC, while the spatial deformation disappears. I.e. the
initial source geometry, which is washed out later on, imprints a flow anisotropy
which is preserved, and observable as “elliptic flow”. A first order phase transition
essentially stalls the buildup of p at about τ = 3 fm/c when the system enters the
Fig. 7.35 Time evolution of
the spatial excentricity x and
the momentum space
anisotropy p (Eqs. (7.47)
and (7.48)) in the
hydrodynamic model of an
Au+Au collision at b = 7 fm,
occurring at
√
s = 200 GeV
[96]. The dynamics is
illustrated with two equations
of state
0.3
0.2
0.1
0
0.1
0.15
0.10
0.05
0
0.05
0
5
10
15
[fm/c]
x
x
RHIC
EOS 1
p
p
373
is positioned at y = 0. The obvious geometrical deformation can be quantified by
the spatial excentricity (unfortunately also labeled in the literature)
x (b) =
y 2 − x 2
y 2 + x 2
(7.47)
where the averages are taken with respect to the transverse density profiles of
Fig. 7.34. x is zero for b = 0, reaching a value of about 0.3 in the case b = 7 fm
illustrated in Fig. 7.34.
Translated into the initialization of the hydrodynamic expansion the density
anisotropy implies a corresponding pressure anisotropy. The pressure is higher in
x than in y direction, and thus is the initial acceleration, leading to an increasing
momentum anisotropy,
p (τ ) =
dx dy (T xx − T yy )
dx dy (T xx + T yy )
(7.48)
where T
μx
(x) is the fluid’s energy-momentum tensor. Figure 7.35 shows [96, 150] the
time evolution of the spatial and momentum anisotropies for the collision considered
in Fig. 7.34, implementing two different equations of state which are modeled with
(without) implication of a first order phase transition in “RHIC” (“EOS1”). A steep
initial rise is observed for p , in both cases: momentum anisotropy builds up during
the early partonic phase at RHIC, while the spatial deformation disappears. I.e. the
initial source geometry, which is washed out later on, imprints a flow anisotropy
which is preserved, and observable as “elliptic flow”. A first order phase transition
essentially stalls the buildup of p at about τ = 3 fm/c when the system enters the
Fig. 7.35 Time evolution of
the spatial excentricity x and
the momentum space
anisotropy p (Eqs. (7.47)
and (7.48)) in the
hydrodynamic model of an
Au+Au collision at b = 7 fm,
occurring at
√
s = 200 GeV
[96]. The dynamics is
illustrated with two equations
of state
0.3
0.2
0.1
0
0.1
0.15
0.10
0.05
0
0.05
0
5
10
15
[fm/c]
x
x
RHIC
EOS 1
p
p