

332
R. Stock
and that the diffuse Woods-Saxon nuclear density profiles lead to a fluctuation of
participant nucleon number at given finite b. Thus the N part fluctuation at finite
weight impact parameters overshadows the genuinely small contribution of near
zero impact parameters. Selecting “central” collisions, either by an on-line trigger
cut on minimal forward energy or maximal total transverse energy or charged
particle rapidity density, or by corresponding off-line selection, one thus faces a
compromise between event statistics and selectivity for impact parameters near
zero. In the example of Fig. 7.11 these considerations suggest a cut at about 8 TeV
which selects the 5% most inelastic events, from among the overall minimum bias
distribution, then to be labeled as “central” collisions. This selection corresponds to
a soft cutoff at b ≤ 3 fm.
The selectivity of this, or of other less stringent cuts on collision centrality is
then established by comparison to a Glauber or cascade model. The bottom panel of
Fig. 7.11 employs the VENUS hadron/string cascade model [68] which starts from a
Monte Carlo position sampling of the nucleons imbedded in Woods-Saxon nuclear
density profiles but (unlike in a Glauber scheme with straight trajectory overlap
projection) following the cascade of inelastic hadron/string multiplication, again by
Monte Carlo sampling. It reproduces the forward energy data reasonably well and
one can thus read off the average impact parameter and participant nucleon number
corresponding to any desired cut on the percent fraction of the total minimum bias
cross section. Moreover, it is clear that this procedure can also be based on the total
minimum bias transverse energy distribution, Fig. 7.3, which is the mirror image
of the forward energy distribution in Fig. 7.11, or on the total, and even the midrapidity charged particle density (Fig. 7.6). The latter method is employed by the
RHIC experiments STAR and PHENIX.
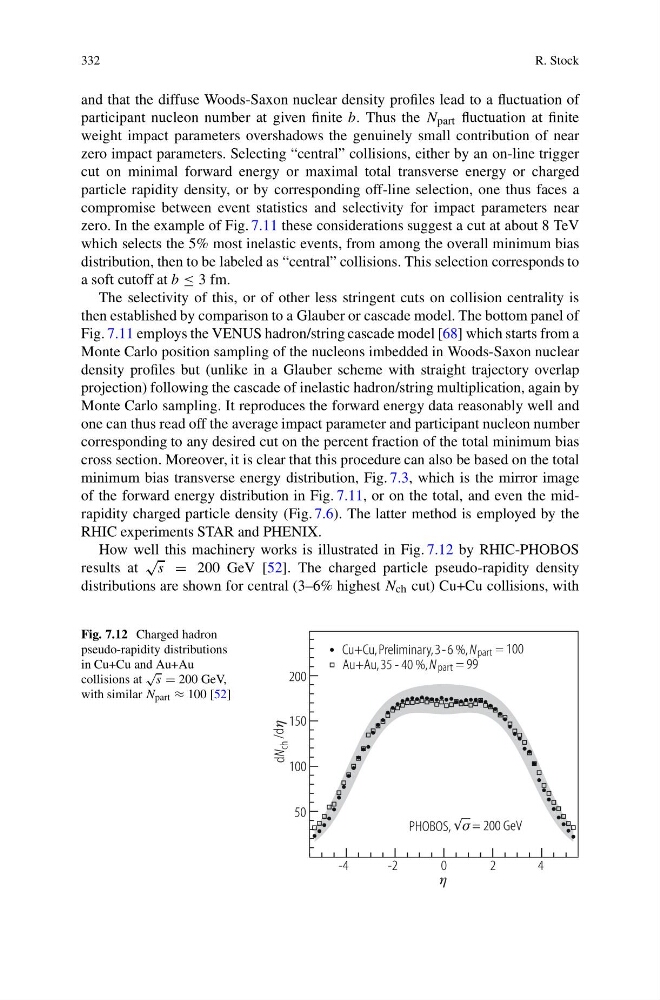
How well this machinery works is illustrated in Fig. 7.12 by RHIC-PHOBOS
results at
√
s = 200 GeV [52]. The charged particle pseudo-rapidity density
distributions are shown for central (3–6% highest N ch cut) Cu+Cu collisions, with
Fig. 7.12 Charged hadron
pseudo-rapidity distributions
in Cu+Cu and Au+Au
collisions at
√
s = 200 GeV,
with similar N part ≈ 100 [52]
R. Stock
and that the diffuse Woods-Saxon nuclear density profiles lead to a fluctuation of
participant nucleon number at given finite b. Thus the N part fluctuation at finite
weight impact parameters overshadows the genuinely small contribution of near
zero impact parameters. Selecting “central” collisions, either by an on-line trigger
cut on minimal forward energy or maximal total transverse energy or charged
particle rapidity density, or by corresponding off-line selection, one thus faces a
compromise between event statistics and selectivity for impact parameters near
zero. In the example of Fig. 7.11 these considerations suggest a cut at about 8 TeV
which selects the 5% most inelastic events, from among the overall minimum bias
distribution, then to be labeled as “central” collisions. This selection corresponds to
a soft cutoff at b ≤ 3 fm.
The selectivity of this, or of other less stringent cuts on collision centrality is
then established by comparison to a Glauber or cascade model. The bottom panel of
Fig. 7.11 employs the VENUS hadron/string cascade model [68] which starts from a
Monte Carlo position sampling of the nucleons imbedded in Woods-Saxon nuclear
density profiles but (unlike in a Glauber scheme with straight trajectory overlap
projection) following the cascade of inelastic hadron/string multiplication, again by
Monte Carlo sampling. It reproduces the forward energy data reasonably well and
one can thus read off the average impact parameter and participant nucleon number
corresponding to any desired cut on the percent fraction of the total minimum bias
cross section. Moreover, it is clear that this procedure can also be based on the total
minimum bias transverse energy distribution, Fig. 7.3, which is the mirror image
of the forward energy distribution in Fig. 7.11, or on the total, and even the midrapidity charged particle density (Fig. 7.6). The latter method is employed by the
RHIC experiments STAR and PHENIX.
How well this machinery works is illustrated in Fig. 7.12 by RHIC-PHOBOS
results at
√
s = 200 GeV [52]. The charged particle pseudo-rapidity density
distributions are shown for central (3–6% highest N ch cut) Cu+Cu collisions, with
Fig. 7.12 Charged hadron
pseudo-rapidity distributions
in Cu+Cu and Au+Au
collisions at
√
s = 200 GeV,
with similar N part ≈ 100 [52]