

326
R. Stock
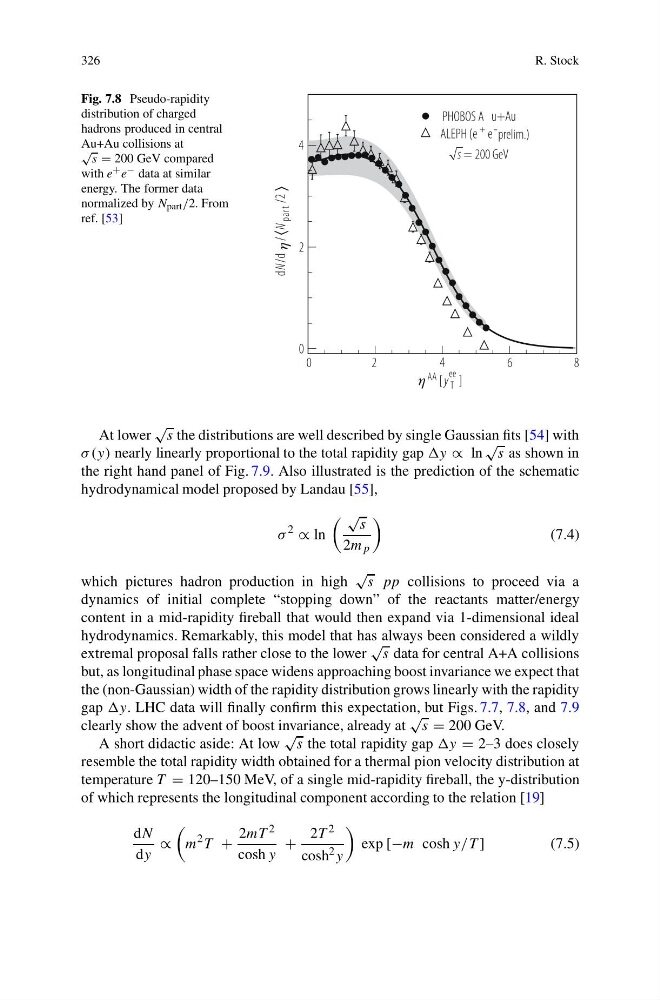
Fig. 7.8 Pseudo-rapidity
distribution of charged
hadrons produced in central
Au+Au collisions at
√
s = 200 GeV compared
with e + e − data at similar
energy. The former data
normalized by N part /2. From
ref. [53]
]
T
ee
[ y
AA
0
2
4
6
8
2
/ r
a
p
t
N / d
/
dN
0
2
4
PHOBOS A u+Au
prelim.)
-
e
+
ALEPH (e
s = 200 GeV
At lower
√
s the distributions are well described by single Gaussian fits [54] with
σ (y) nearly linearly proportional to the total rapidity gap ∝ ln
√
s as shown in
the right hand panel of Fig. 7.9. Also illustrated is the prediction of the schematic
hydrodynamical model proposed by Landau [55],
σ
2
∝ ln
√
s
2m p
(7.4)
which pictures hadron production in high
√
s pp collisions to proceed via a
dynamics of initial complete “stopping down” of the reactants matter/energy
content in a mid-rapidity fireball that would then expand via 1-dimensional ideal
hydrodynamics. Remarkably, this model that has always been considered a wildly
extremal proposal falls rather close to the lower
√
s data for central A+A collisions
but, as longitudinal phase space widens approaching boost invariance we expect that
the (non-Gaussian) width of the rapidity distribution grows linearly with the rapidity
gap y. LHC data will finally confirm this expectation, but Figs. 7.7, 7.8, and 7.9
clearly show the advent of boost invariance, already at
√
s = 200 GeV.
A short didactic aside: At low
√
s the total rapidity gap = 2–3 does closely
resemble the total rapidity width obtained for a thermal pion velocity distribution at
temperature T = 120–150 MeV, of a single mid-rapidity fireball, the y-distribution
of which represents the longitudinal component according to the relation [19]
dN
dy
∝
m
2 T +
2mT 2
cosh y
+
2T 2
cosh 2 y
exp [−m cosh y/T ]
(7.5)
R. Stock
Fig. 7.8 Pseudo-rapidity
distribution of charged
hadrons produced in central
Au+Au collisions at
√
s = 200 GeV compared
with e + e − data at similar
energy. The former data
normalized by N part /2. From
ref. [53]
]
T
ee
[ y
AA
0
2
4
6
8
2
/ r
a
p
t
N / d
/
dN
0
2
4
PHOBOS A u+Au
prelim.)
-
e
+
ALEPH (e
s = 200 GeV
At lower
√
s the distributions are well described by single Gaussian fits [54] with
σ (y) nearly linearly proportional to the total rapidity gap ∝ ln
√
s as shown in
the right hand panel of Fig. 7.9. Also illustrated is the prediction of the schematic
hydrodynamical model proposed by Landau [55],
σ
2
∝ ln
√
s
2m p
(7.4)
which pictures hadron production in high
√
s pp collisions to proceed via a
dynamics of initial complete “stopping down” of the reactants matter/energy
content in a mid-rapidity fireball that would then expand via 1-dimensional ideal
hydrodynamics. Remarkably, this model that has always been considered a wildly
extremal proposal falls rather close to the lower
√
s data for central A+A collisions
but, as longitudinal phase space widens approaching boost invariance we expect that
the (non-Gaussian) width of the rapidity distribution grows linearly with the rapidity
gap y. LHC data will finally confirm this expectation, but Figs. 7.7, 7.8, and 7.9
clearly show the advent of boost invariance, already at
√
s = 200 GeV.
A short didactic aside: At low
√
s the total rapidity gap = 2–3 does closely
resemble the total rapidity width obtained for a thermal pion velocity distribution at
temperature T = 120–150 MeV, of a single mid-rapidity fireball, the y-distribution
of which represents the longitudinal component according to the relation [19]
dN
dy
∝
m
2 T +
2mT 2
cosh y
+
2T 2
cosh 2 y
exp [−m cosh y/T ]
(7.5)