

7 Relativistic Nucleus-Nucleus Collisions and the QCD Matter Phase Diagram
325
8
7
6
5
4
3
2
1
0
-5
-3
-1
1
3
5
d
/
d
N h
c
W ev
Minimum bias
s = 540 GeV
W.
m.b.
0 - 6
%
15 - 25 %
35 - 45
%
0
100
200
300
400
500
600
700
-5
-3
-1
1
3
5
d
/
d
N h
c
s = 130 GeV
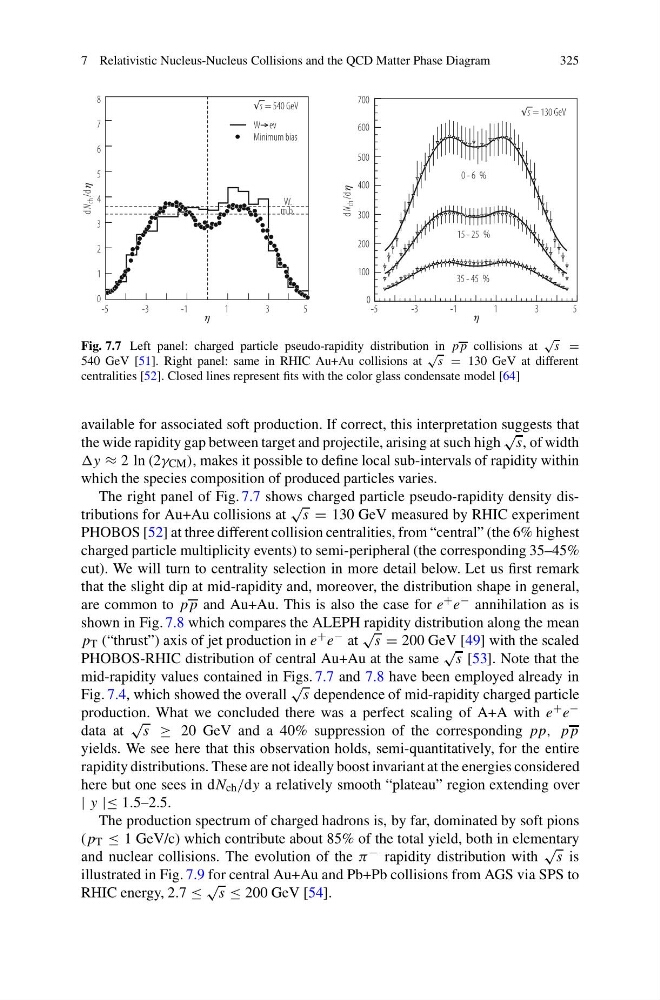
Fig. 7.7 Left panel: charged particle pseudo-rapidity distribution in pp collisions at
√
s =
540 GeV [51]. Right panel: same in RHIC Au+Au collisions at
√
s = 130 GeV at different
centralities [52]. Closed lines represent fits with the color glass condensate model [64]
available for associated soft production. If correct, this interpretation suggests that
the wide rapidity gap between target and projectile, arising at such high
√
s, of width
≈ 2 ln (2γ CM ), makes it possible to define local sub-intervals of rapidity within
which the species composition of produced particles varies.
The right panel of Fig. 7.7 shows charged particle pseudo-rapidity density distributions for Au+Au collisions at
√
s = 130 GeV measured by RHIC experiment
PHOBOS [52] at three different collision centralities, from “central” (the 6% highest
charged particle multiplicity events) to semi-peripheral (the corresponding 35–45%
cut). We will turn to centrality selection in more detail below. Let us first remark
that the slight dip at mid-rapidity and, moreover, the distribution shape in general,
are common to pp and Au+Au. This is also the case for e + e − annihilation as is
shown in Fig. 7.8 which compares the ALEPH rapidity distribution along the mean
p T (“thrust”) axis of jet production in e + e − at
√
s = 200 GeV [49] with the scaled
PHOBOS-RHIC distribution of central Au+Au at the same
√
s [53]. Note that the
mid-rapidity values contained in Figs. 7.7 and 7.8 have been employed already in
Fig. 7.4, which showed the overall
√
s dependence of mid-rapidity charged particle
production. What we concluded there was a perfect scaling of A+A with e + e −
data at
√
s ≥ 20 GeV and a 40% suppression of the corresponding pp, pp
yields. We see here that this observation holds, semi-quantitatively, for the entire
rapidity distributions. These are not ideally boost invariant at the energies considered
here but one sees in dN ch /dy a relatively smooth “plateau” region extending over
| y |≤ 1.5–2.5.
The production spectrum of charged hadrons is, by far, dominated by soft pions
(p T ≤ 1 GeV/c) which contribute about 85% of the total yield, both in elementary
and nuclear collisions. The evolution of the π − rapidity distribution with
√
s is
illustrated in Fig. 7.9 for central Au+Au and Pb+Pb collisions from AGS via SPS to
RHIC energy, 2.7 ≤
√
s ≤ 200 GeV [54].
325
8
7
6
5
4
3
2
1
0
-5
-3
-1
1
3
5
d
/
d
N h
c
W ev
Minimum bias
s = 540 GeV
W.
m.b.
0 - 6
%
15 - 25 %
35 - 45
%
0
100
200
300
400
500
600
700
-5
-3
-1
1
3
5
d
/
d
N h
c
s = 130 GeV
Fig. 7.7 Left panel: charged particle pseudo-rapidity distribution in pp collisions at
√
s =
540 GeV [51]. Right panel: same in RHIC Au+Au collisions at
√
s = 130 GeV at different
centralities [52]. Closed lines represent fits with the color glass condensate model [64]
available for associated soft production. If correct, this interpretation suggests that
the wide rapidity gap between target and projectile, arising at such high
√
s, of width
≈ 2 ln (2γ CM ), makes it possible to define local sub-intervals of rapidity within
which the species composition of produced particles varies.
The right panel of Fig. 7.7 shows charged particle pseudo-rapidity density distributions for Au+Au collisions at
√
s = 130 GeV measured by RHIC experiment
PHOBOS [52] at three different collision centralities, from “central” (the 6% highest
charged particle multiplicity events) to semi-peripheral (the corresponding 35–45%
cut). We will turn to centrality selection in more detail below. Let us first remark
that the slight dip at mid-rapidity and, moreover, the distribution shape in general,
are common to pp and Au+Au. This is also the case for e + e − annihilation as is
shown in Fig. 7.8 which compares the ALEPH rapidity distribution along the mean
p T (“thrust”) axis of jet production in e + e − at
√
s = 200 GeV [49] with the scaled
PHOBOS-RHIC distribution of central Au+Au at the same
√
s [53]. Note that the
mid-rapidity values contained in Figs. 7.7 and 7.8 have been employed already in
Fig. 7.4, which showed the overall
√
s dependence of mid-rapidity charged particle
production. What we concluded there was a perfect scaling of A+A with e + e −
data at
√
s ≥ 20 GeV and a 40% suppression of the corresponding pp, pp
yields. We see here that this observation holds, semi-quantitatively, for the entire
rapidity distributions. These are not ideally boost invariant at the energies considered
here but one sees in dN ch /dy a relatively smooth “plateau” region extending over
| y |≤ 1.5–2.5.
The production spectrum of charged hadrons is, by far, dominated by soft pions
(p T ≤ 1 GeV/c) which contribute about 85% of the total yield, both in elementary
and nuclear collisions. The evolution of the π − rapidity distribution with
√
s is
illustrated in Fig. 7.9 for central Au+Au and Pb+Pb collisions from AGS via SPS to
RHIC energy, 2.7 ≤
√
s ≤ 200 GeV [54].