

324
R. Stock
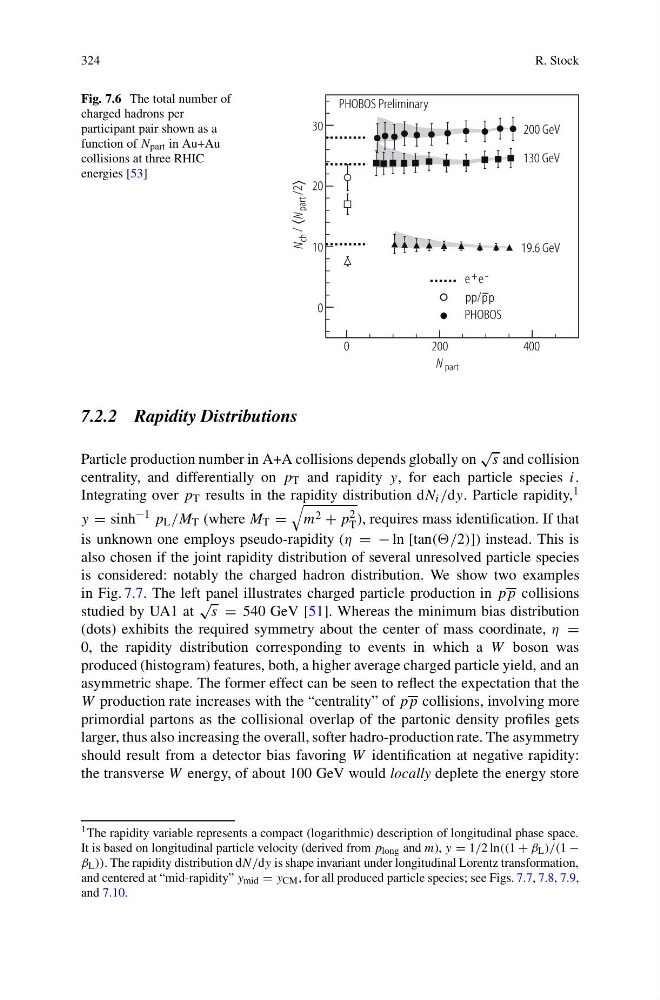
Fig. 7.6 The total number of
charged hadrons per
participant pair shown as a
function of N part in Au+Au
collisions at three RHIC
energies [53]
7.2.2 Rapidity Distributions
Particle production number in A+A collisions depends globally on
√
s and collision
centrality, and differentially on p T and rapidity y, for each particle species i.
Integrating over p T results in the rapidity distribution dN i /dy. Particle rapidity, 1
y = sinh
−1 p L /M T (where M T =
m 2 + p 2
T ), requires mass identification. If that
is unknown one employs pseudo-rapidity (η = − ln [tan((/2)]) instead. This is
also chosen if the joint rapidity distribution of several unresolved particle species
is considered: notably the charged hadron distribution. We show two examples
in Fig. 7.7. The left panel illustrates charged particle production in pp collisions
studied by UA1 at
√
s = 540 GeV [51]. Whereas the minimum bias distribution
(dots) exhibits the required symmetry about the center of mass coordinate, η =
0, the rapidity distribution corresponding to events in which a W boson was
produced (histogram) features, both, a higher average charged particle yield, and an
asymmetric shape. The former effect can be seen to reflect the expectation that the
W production rate increases with the “centrality” of pp collisions, involving more
primordial partons as the collisional overlap of the partonic density profiles gets
larger, thus also increasing the overall, softer hadro-production rate. The asymmetry
should result from a detector bias favoring W identification at negative rapidity:
the transverse W energy, of about 100 GeV would locally deplete the energy store
1 The rapidity variable represents a compact (logarithmic) description of longitudinal phase space.
It is based on longitudinal particle velocity (derived from p long and m), y = 1/2 ln((1 + β L )/(1 −
β L )). The rapidity distribution dN/dy is shape invariant under longitudinal Lorentz transformation,
and centered at “mid-rapidity” y mid = y CM , for all produced particle species; see Figs. 7.7, 7.8, 7.9,
and 7.10.
R. Stock
Fig. 7.6 The total number of
charged hadrons per
participant pair shown as a
function of N part in Au+Au
collisions at three RHIC
energies [53]
7.2.2 Rapidity Distributions
Particle production number in A+A collisions depends globally on
√
s and collision
centrality, and differentially on p T and rapidity y, for each particle species i.
Integrating over p T results in the rapidity distribution dN i /dy. Particle rapidity, 1
y = sinh
−1 p L /M T (where M T =
m 2 + p 2
T ), requires mass identification. If that
is unknown one employs pseudo-rapidity (η = − ln [tan((/2)]) instead. This is
also chosen if the joint rapidity distribution of several unresolved particle species
is considered: notably the charged hadron distribution. We show two examples
in Fig. 7.7. The left panel illustrates charged particle production in pp collisions
studied by UA1 at
√
s = 540 GeV [51]. Whereas the minimum bias distribution
(dots) exhibits the required symmetry about the center of mass coordinate, η =
0, the rapidity distribution corresponding to events in which a W boson was
produced (histogram) features, both, a higher average charged particle yield, and an
asymmetric shape. The former effect can be seen to reflect the expectation that the
W production rate increases with the “centrality” of pp collisions, involving more
primordial partons as the collisional overlap of the partonic density profiles gets
larger, thus also increasing the overall, softer hadro-production rate. The asymmetry
should result from a detector bias favoring W identification at negative rapidity:
the transverse W energy, of about 100 GeV would locally deplete the energy store
1 The rapidity variable represents a compact (logarithmic) description of longitudinal phase space.
It is based on longitudinal particle velocity (derived from p long and m), y = 1/2 ln((1 + β L )/(1 −
β L )). The rapidity distribution dN/dy is shape invariant under longitudinal Lorentz transformation,
and centered at “mid-rapidity” y mid = y CM , for all produced particle species; see Figs. 7.7, 7.8, 7.9,
and 7.10.