

6 The Discovery of the Higgs Boson at the LHC
305
through their websites quoted in references [36, 37]. Much more data need to be
collected to enable rigorous testing of the compatibility of the Higgs boson with
the SM and to get clues to physics lying beyond the SM in case of a significant
deviation. This is one of the main motivations for the high luminosity LHC project,
labeled the HL-LHC.
Europe’s topmost priority in particle physics calls for the exploitation of the full
potential of the LHC, including the high-luminosity upgrade of the accelerator and
detectors with a view to collecting ten times more data than in the initial design. It is
planned to increase the instantaneous luminosity of the LHC to 5 × 10 34 cm −2 s −1 ,
and record, by around 2035, an integrated luminosity corresponding to ~3000 fb −1
(ten times larger than the original design value). Such an integrated luminosity also
requires substantial upgrades of the ATLAS and CMS experiments, now underway,
to allow a very precise measurement of the properties of the Higgs boson the study
of its rare decay modes and self-coupling, in addition to the search for physics
beyond the SM. Many theories beyond the SM make different predictions for the
properties of one or more Higgs bosons.
Based on the currently analysed data ATLAS and CMS experiments have
recently made projections of the attainable sensitivity for such measurements by
the end of the HL-LHC phase [59, 60]. As around 150 million Higgs bosons will
be produced a search can also be made for exotic and rare decays of the boson.
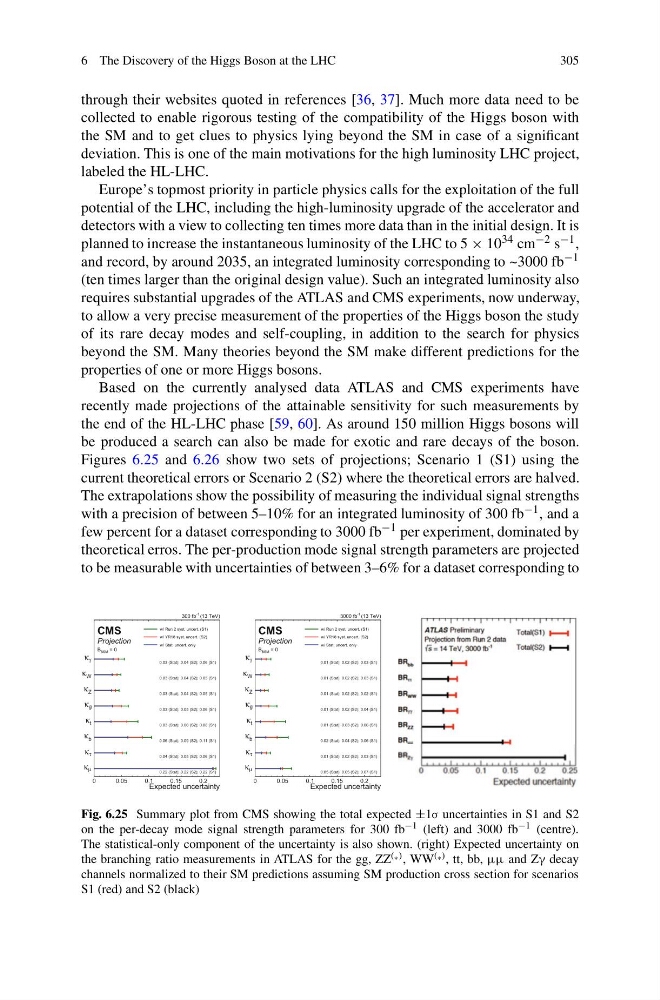
Figures 6.25 and 6.26 show two sets of projections; Scenario 1 (S1) using the
current theoretical errors or Scenario 2 (S2) where the theoretical errors are halved.
The extrapolations show the possibility of measuring the individual signal strengths
with a precision of between 5–10% for an integrated luminosity of 300 fb −1 , and a
few percent for a dataset corresponding to 3000 fb −1 per experiment, dominated by
theoretical erros. The per-production mode signal strength parameters are projected
to be measurable with uncertainties of between 3–6% for a dataset corresponding to
Expected uncertainty
0
0.05
0.1
0.15
0.2
μ
κ
τ
κ
b
κ
t
κ
g
κ
Z
κ
W
κ
γ
κ
0.22 (Stat); 0.22 (S2); 0.22 (S1)
0.04 (Stat); 0.05 (S2); 0.06 (S1)
0.06 (Stat); 0.09 (S2); 0.11 (S1)
0.03 (Stat); 0.06 (S2); 0.08 (S1)
0.03 (Stat); 0.05 (S2); 0.06 (S1)
0.03 (Stat); 0.04 (S2); 0.05 (S1)
0.03 (Stat); 0.04 (S2); 0.05 (S1)
0.03 (Stat); 0.04 (S2); 0.06 (S1)
(13 TeV)
-1
300 fb
CMS
Projection
= 0
BSM
B
w/ Run 2 syst. uncert. (S1)
w/ YR18 syst. uncert. (S2)
w/ Stat. uncert. only
Expected uncertainty
0
0.05
0.1
0.15
0.2
μ
κ
τ
κ
b
κ
t
κ
g
κ
Z
κ
W
κ
γ
κ
0.05 (Stat); 0.05 (S2); 0.07 (S1)
0.01 (Stat); 0.02 (S2); 0.03 (S1)
0.02 (Stat); 0.04 (S2); 0.06 (S1)
0.01 (Stat); 0.03 (S2); 0.06 (S1)
0.01 (Stat); 0.02 (S2); 0.04 (S1)
0.01 (Stat); 0.02 (S2); 0.02 (S1)
0.01 (Stat); 0.02 (S2); 0.03 (S1)
0.01 (Stat); 0.02 (S2); 0.03 (S1)
(13 TeV)
-1
3000 fb
CMS
Projection
= 0
BSM
B
w/ Run 2 syst. uncert. (S1)
w/ YR18 syst. uncert. (S2)
w/ Stat. uncert. only
Fig. 6.25 Summary plot from CMS showing the total expected ±1σ uncertainties in S1 and S2
on the per-decay mode signal strength parameters for 300 fb −1 (left) and 3000 fb −1 (centre).
The statistical-only component of the uncertainty is also shown. (right) Expected uncertainty on
the branching ratio measurements in ATLAS for the gg, ZZ (∗) , WW (∗) , tt, bb, μμ and Zγ decay
channels normalized to their SM predictions assuming SM production cross section for scenarios
S1 (red) and S2 (black)
305
through their websites quoted in references [36, 37]. Much more data need to be
collected to enable rigorous testing of the compatibility of the Higgs boson with
the SM and to get clues to physics lying beyond the SM in case of a significant
deviation. This is one of the main motivations for the high luminosity LHC project,
labeled the HL-LHC.
Europe’s topmost priority in particle physics calls for the exploitation of the full
potential of the LHC, including the high-luminosity upgrade of the accelerator and
detectors with a view to collecting ten times more data than in the initial design. It is
planned to increase the instantaneous luminosity of the LHC to 5 × 10 34 cm −2 s −1 ,
and record, by around 2035, an integrated luminosity corresponding to ~3000 fb −1
(ten times larger than the original design value). Such an integrated luminosity also
requires substantial upgrades of the ATLAS and CMS experiments, now underway,
to allow a very precise measurement of the properties of the Higgs boson the study
of its rare decay modes and self-coupling, in addition to the search for physics
beyond the SM. Many theories beyond the SM make different predictions for the
properties of one or more Higgs bosons.
Based on the currently analysed data ATLAS and CMS experiments have
recently made projections of the attainable sensitivity for such measurements by
the end of the HL-LHC phase [59, 60]. As around 150 million Higgs bosons will
be produced a search can also be made for exotic and rare decays of the boson.
Figures 6.25 and 6.26 show two sets of projections; Scenario 1 (S1) using the
current theoretical errors or Scenario 2 (S2) where the theoretical errors are halved.
The extrapolations show the possibility of measuring the individual signal strengths
with a precision of between 5–10% for an integrated luminosity of 300 fb −1 , and a
few percent for a dataset corresponding to 3000 fb −1 per experiment, dominated by
theoretical erros. The per-production mode signal strength parameters are projected
to be measurable with uncertainties of between 3–6% for a dataset corresponding to
Expected uncertainty
0
0.05
0.1
0.15
0.2
μ
κ
τ
κ
b
κ
t
κ
g
κ
Z
κ
W
κ
γ
κ
0.22 (Stat); 0.22 (S2); 0.22 (S1)
0.04 (Stat); 0.05 (S2); 0.06 (S1)
0.06 (Stat); 0.09 (S2); 0.11 (S1)
0.03 (Stat); 0.06 (S2); 0.08 (S1)
0.03 (Stat); 0.05 (S2); 0.06 (S1)
0.03 (Stat); 0.04 (S2); 0.05 (S1)
0.03 (Stat); 0.04 (S2); 0.05 (S1)
0.03 (Stat); 0.04 (S2); 0.06 (S1)
(13 TeV)
-1
300 fb
CMS
Projection
= 0
BSM
B
w/ Run 2 syst. uncert. (S1)
w/ YR18 syst. uncert. (S2)
w/ Stat. uncert. only
Expected uncertainty
0
0.05
0.1
0.15
0.2
μ
κ
τ
κ
b
κ
t
κ
g
κ
Z
κ
W
κ
γ
κ
0.05 (Stat); 0.05 (S2); 0.07 (S1)
0.01 (Stat); 0.02 (S2); 0.03 (S1)
0.02 (Stat); 0.04 (S2); 0.06 (S1)
0.01 (Stat); 0.03 (S2); 0.06 (S1)
0.01 (Stat); 0.02 (S2); 0.04 (S1)
0.01 (Stat); 0.02 (S2); 0.02 (S1)
0.01 (Stat); 0.02 (S2); 0.03 (S1)
0.01 (Stat); 0.02 (S2); 0.03 (S1)
(13 TeV)
-1
3000 fb
CMS
Projection
= 0
BSM
B
w/ Run 2 syst. uncert. (S1)
w/ YR18 syst. uncert. (S2)
w/ Stat. uncert. only
Fig. 6.25 Summary plot from CMS showing the total expected ±1σ uncertainties in S1 and S2
on the per-decay mode signal strength parameters for 300 fb −1 (left) and 3000 fb −1 (centre).
The statistical-only component of the uncertainty is also shown. (right) Expected uncertainty on
the branching ratio measurements in ATLAS for the gg, ZZ (∗) , WW (∗) , tt, bb, μμ and Zγ decay
channels normalized to their SM predictions assuming SM production cross section for scenarios
S1 (red) and S2 (black)