

304
P. Jenni and T. S. Virdee
ATLAS
Data
Arbitrary normalisation
1
10 –1
10 –2
10 –3
10 –4
10
10 –5
20
10
0
–10
–20
–30
30
q
~
0 + SM
0 –
ATLAS
Data
Arbitrary normalisation
1
10
10 –1
10 –2
10 –3
10 –4
10 4
10 3
10 2
10 –5
20
10
0
–10
–20
–30
30
q
~
0 + SM
2 + ( q =2 g p T <125 GeV)
s = 7 TeV, 4.5 fb –1
s = 8 TeV, 20.3 fb –1
s = 7 TeV, 4.5 fb –1
s = 8 TeV, 20.3 fb –1
s = 8 TeV, 20.3 fb –1
H
WW*
e
e
H
H
ZZ*
4l
s = 7 TeV, 4.5fb –1
s = 8 TeV, 20.3 fb –1
s = 8 TeV, 20.3 fb –1
H
WW*
H
ZZ*
4l
(a)
(b)
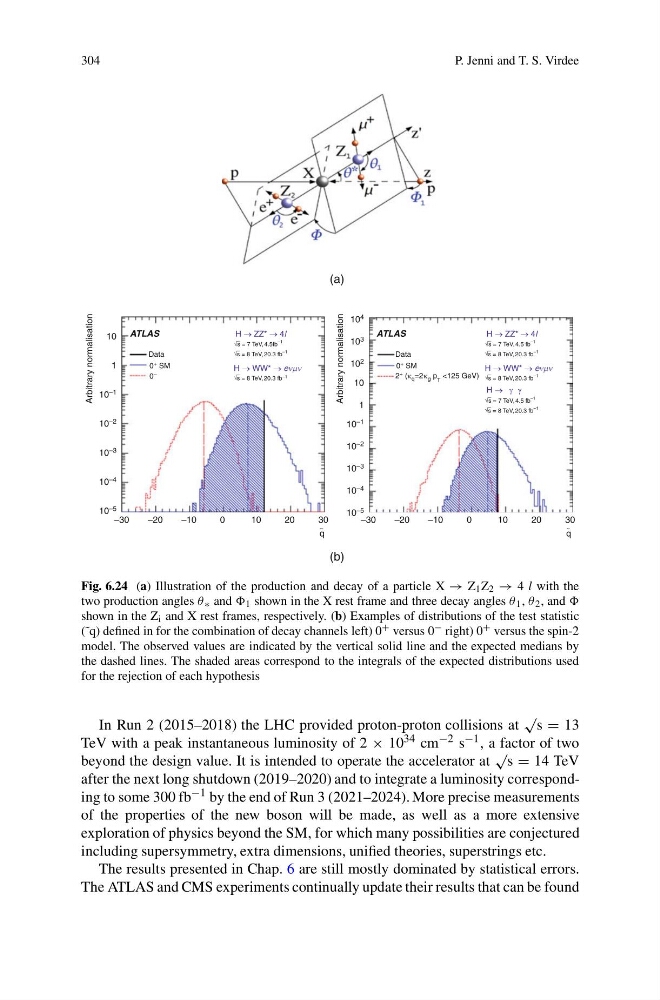
Fig. 6.24 (a) Illustration of the production and decay of a particle X → Z 1 Z 2 → 4 l with the
two production angles θ ∗ and 1 shown in the X rest frame and three decay angles θ 1 , θ 2 , and
shown in the Z i and X rest frames, respectively. (b) Examples of distributions of the test statistic
(˜q) defined in for the combination of decay channels left) 0 + versus 0 − right) 0 + versus the spin-2
model. The observed values are indicated by the vertical solid line and the expected medians by
the dashed lines. The shaded areas correspond to the integrals of the expected distributions used
for the rejection of each hypothesis
In Run 2 (2015–2018) the LHC provided proton-proton collisions at
√ s = 13
TeV with a peak instantaneous luminosity of 2 × 10 34 cm −2 s −1 , a factor of two
beyond the design value. It is intended to operate the accelerator at
√ s = 14 TeV
after the next long shutdown (2019–2020) and to integrate a luminosity corresponding to some 300 fb −1 by the end of Run 3 (2021–2024). More precise measurements
of the properties of the new boson will be made, as well as a more extensive
exploration of physics beyond the SM, for which many possibilities are conjectured
including supersymmetry, extra dimensions, unified theories, superstrings etc.
The results presented in Chap. 6 are still mostly dominated by statistical errors.
The ATLAS and CMS experiments continually update their results that can be found
P. Jenni and T. S. Virdee
ATLAS
Data
Arbitrary normalisation
1
10 –1
10 –2
10 –3
10 –4
10
10 –5
20
10
0
–10
–20
–30
30
q
~
0 + SM
0 –
ATLAS
Data
Arbitrary normalisation
1
10
10 –1
10 –2
10 –3
10 –4
10 4
10 3
10 2
10 –5
20
10
0
–10
–20
–30
30
q
~
0 + SM
2 + ( q =2 g p T <125 GeV)
s = 7 TeV, 4.5 fb –1
s = 8 TeV, 20.3 fb –1
s = 7 TeV, 4.5 fb –1
s = 8 TeV, 20.3 fb –1
s = 8 TeV, 20.3 fb –1
H
WW*
e
e
H
H
ZZ*
4l
s = 7 TeV, 4.5fb –1
s = 8 TeV, 20.3 fb –1
s = 8 TeV, 20.3 fb –1
H
WW*
H
ZZ*
4l
(a)
(b)
Fig. 6.24 (a) Illustration of the production and decay of a particle X → Z 1 Z 2 → 4 l with the
two production angles θ ∗ and 1 shown in the X rest frame and three decay angles θ 1 , θ 2 , and
shown in the Z i and X rest frames, respectively. (b) Examples of distributions of the test statistic
(˜q) defined in for the combination of decay channels left) 0 + versus 0 − right) 0 + versus the spin-2
model. The observed values are indicated by the vertical solid line and the expected medians by
the dashed lines. The shaded areas correspond to the integrals of the expected distributions used
for the rejection of each hypothesis
In Run 2 (2015–2018) the LHC provided proton-proton collisions at
√ s = 13
TeV with a peak instantaneous luminosity of 2 × 10 34 cm −2 s −1 , a factor of two
beyond the design value. It is intended to operate the accelerator at
√ s = 14 TeV
after the next long shutdown (2019–2020) and to integrate a luminosity corresponding to some 300 fb −1 by the end of Run 3 (2021–2024). More precise measurements
of the properties of the new boson will be made, as well as a more extensive
exploration of physics beyond the SM, for which many possibilities are conjectured
including supersymmetry, extra dimensions, unified theories, superstrings etc.
The results presented in Chap. 6 are still mostly dominated by statistical errors.
The ATLAS and CMS experiments continually update their results that can be found