

294
P. Jenni and T. S. Virdee
significance of 5.9 standard deviations, equal to the expected significance. Figure
6.15b right plots the signal strength per category for m H = 125.09 GeV.
ATLAS has observed the H → τ τ mode using 36.1 fb −1 of data recorded at
√
s = 13 TeV [46]. All combinations of leptonic and hadronic tau decays were
considered. Combining all data taken at
√
s = 7, 8 and 13 TeV, the observed
(expected) significance is found to be 6.4 (5.4) standard deviations. Using the data
taken at
√
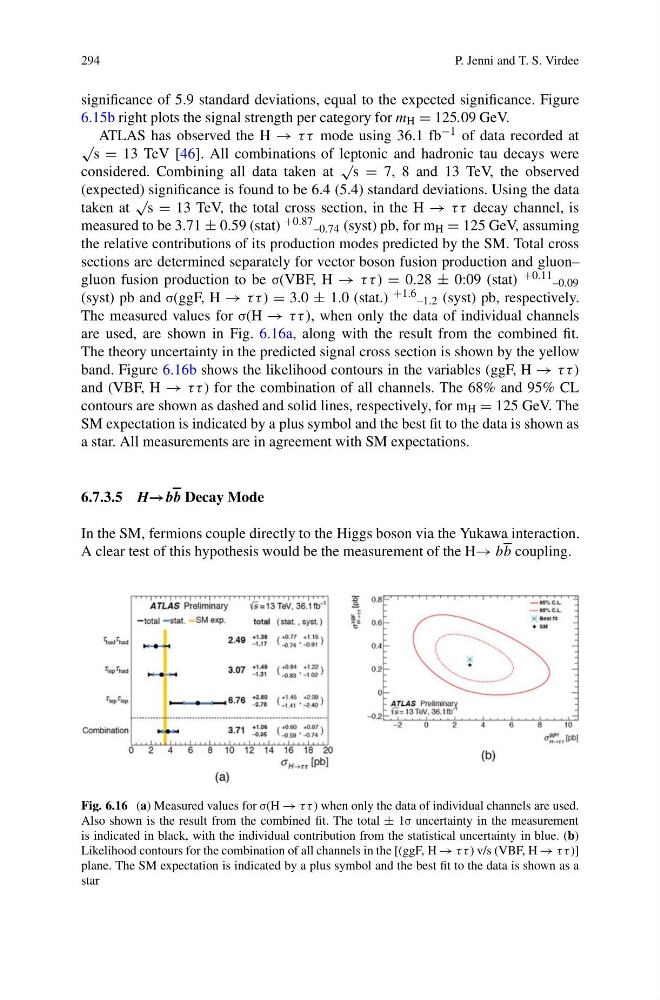
s = 13 TeV, the total cross section, in the H → τ τ decay channel, is
measured to be 3.71 ± 0.59 (stat) +0.87 –0.74 (syst) pb, for m H = 125 GeV, assuming
the relative contributions of its production modes predicted by the SM. Total cross
sections are determined separately for vector boson fusion production and gluon–
gluon fusion production to be σ(VBF, H → τ τ ) = 0.28 ± 0:09 (stat) +0.11 –0.09
(syst) pb and σ(ggF, H → τ τ ) = 3.0 ± 1.0 (stat.) +1.6 –1.2 (syst) pb, respectively.
The measured values for σ(H → τ τ ), when only the data of individual channels
are used, are shown in Fig. 6.16a, along with the result from the combined fit.
The theory uncertainty in the predicted signal cross section is shown by the yellow
band. Figure 6.16b shows the likelihood contours in the variables (ggF, H → τ τ )
and (VBF, H → τ τ ) for the combination of all channels. The 68% and 95% CL
contours are shown as dashed and solid lines, respectively, for m H = 125 GeV. The
SM expectation is indicated by a plus symbol and the best fit to the data is shown as
a star. All measurements are in agreement with SM expectations.
6.7.3.5 H→bb Decay Mode
In the SM, fermions couple directly to the Higgs boson via the Yukawa interaction.
A clear test of this hypothesis would be the measurement of the H→ bb coupling.
Fig. 6.16 (a) Measured values for σ(H → τ τ ) when only the data of individual channels are used.
Also shown is the result from the combined fit. The total ± 1σ uncertainty in the measurement
is indicated in black, with the individual contribution from the statistical uncertainty in blue. (b)
Likelihood contours for the combination of all channels in the [(ggF, H → τ τ ) v/s (VBF, H → τ τ )]
plane. The SM expectation is indicated by a plus symbol and the best fit to the data is shown as a
star
P. Jenni and T. S. Virdee
significance of 5.9 standard deviations, equal to the expected significance. Figure
6.15b right plots the signal strength per category for m H = 125.09 GeV.
ATLAS has observed the H → τ τ mode using 36.1 fb −1 of data recorded at
√
s = 13 TeV [46]. All combinations of leptonic and hadronic tau decays were
considered. Combining all data taken at
√
s = 7, 8 and 13 TeV, the observed
(expected) significance is found to be 6.4 (5.4) standard deviations. Using the data
taken at
√
s = 13 TeV, the total cross section, in the H → τ τ decay channel, is
measured to be 3.71 ± 0.59 (stat) +0.87 –0.74 (syst) pb, for m H = 125 GeV, assuming
the relative contributions of its production modes predicted by the SM. Total cross
sections are determined separately for vector boson fusion production and gluon–
gluon fusion production to be σ(VBF, H → τ τ ) = 0.28 ± 0:09 (stat) +0.11 –0.09
(syst) pb and σ(ggF, H → τ τ ) = 3.0 ± 1.0 (stat.) +1.6 –1.2 (syst) pb, respectively.
The measured values for σ(H → τ τ ), when only the data of individual channels
are used, are shown in Fig. 6.16a, along with the result from the combined fit.
The theory uncertainty in the predicted signal cross section is shown by the yellow
band. Figure 6.16b shows the likelihood contours in the variables (ggF, H → τ τ )
and (VBF, H → τ τ ) for the combination of all channels. The 68% and 95% CL
contours are shown as dashed and solid lines, respectively, for m H = 125 GeV. The
SM expectation is indicated by a plus symbol and the best fit to the data is shown as
a star. All measurements are in agreement with SM expectations.
6.7.3.5 H→bb Decay Mode
In the SM, fermions couple directly to the Higgs boson via the Yukawa interaction.
A clear test of this hypothesis would be the measurement of the H→ bb coupling.
Fig. 6.16 (a) Measured values for σ(H → τ τ ) when only the data of individual channels are used.
Also shown is the result from the combined fit. The total ± 1σ uncertainty in the measurement
is indicated in black, with the individual contribution from the statistical uncertainty in blue. (b)
Likelihood contours for the combination of all channels in the [(ggF, H → τ τ ) v/s (VBF, H → τ τ )]
plane. The SM expectation is indicated by a plus symbol and the best fit to the data is shown as a
star