

6 The Discovery of the Higgs Boson at the LHC
295
The H → bb decay mode has by far the largest branching ratio (~58%). However,
this is the most difficult decay channel to observe, since bottom quark pairs are
prolifically produced by QCD processes and give rise to a formidable background.
The cross section for b-quark pair production, σ bb (QCD), is ~10 7 × σ(H → bb).
Therefore the search concentrates on Higgs boson production in association with a
W or Z boson using the following decay modes: W → eν/μν and Z → ee or μμ or
νν. The Z → νν decay is identified by the requirement of a large missing transverse
energy. The Higgs boson candidate is reconstructed by requiring two b-tagged jets.
Events are selected in 0-, 1- and 2-charged lepton (e or μ) channels, to explore the
ZH → ννbb, WH → lνbb, ZH → llbb signatures, respectively. Both experiments
introduced several improvements since the initial searches including more efficient
identification of b-jets, better dijet mass resolution and use of multivariate discriminants that better separate signal from background. Multivariate discriminants,
built from variables that describe the kinematics of the selected events, are used to
maximise the sensitivity to the Higgs boson signal. The signal extraction method
is validated with, for example, the diboson analysis where the nominal multivariate
analysis is modified to extract the VZ, Z → bb diboson process.
ATLAS has observed the mode H → bb by analyzing the combined data from
Run 1 and Run 2 [47], corresponding to an integrated luminosity of 80fb −1 yielding
an observed (expected) significance of 5.4 (5.5) standard deviations, thus providing
direct observation of the Higgs boson decay into b-quarks. The signal strength is
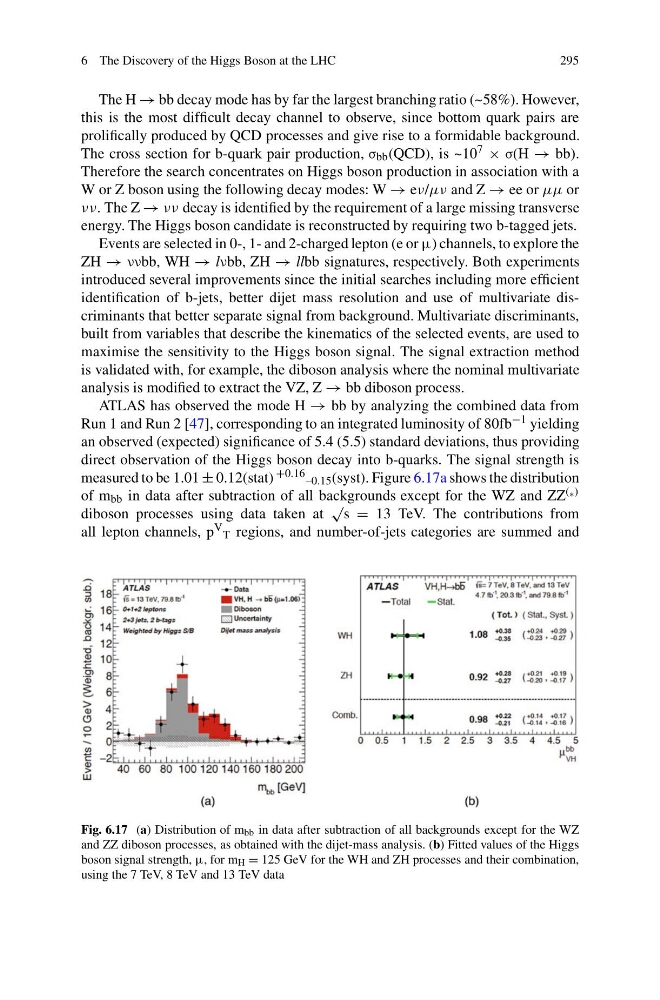
measured to be 1.01 ± 0.12(stat) +0.16 –0.15 (syst). Figure 6.17a shows the distribution
of m bb in data after subtraction of all backgrounds except for the WZ and ZZ ( ∗ )
diboson processes using data taken at
√ s = 13 TeV. The contributions from
all lepton channels, p V T regions, and number-of-jets categories are summed and
Fig. 6.17 (a) Distribution of m bb in data after subtraction of all backgrounds except for the WZ
and ZZ diboson processes, as obtained with the dijet-mass analysis. (b) Fitted values of the Higgs
boson signal strength, μ, for m H = 125 GeV for the WH and ZH processes and their combination,
using the 7 TeV, 8 TeV and 13 TeV data
295
The H → bb decay mode has by far the largest branching ratio (~58%). However,
this is the most difficult decay channel to observe, since bottom quark pairs are
prolifically produced by QCD processes and give rise to a formidable background.
The cross section for b-quark pair production, σ bb (QCD), is ~10 7 × σ(H → bb).
Therefore the search concentrates on Higgs boson production in association with a
W or Z boson using the following decay modes: W → eν/μν and Z → ee or μμ or
νν. The Z → νν decay is identified by the requirement of a large missing transverse
energy. The Higgs boson candidate is reconstructed by requiring two b-tagged jets.
Events are selected in 0-, 1- and 2-charged lepton (e or μ) channels, to explore the
ZH → ννbb, WH → lνbb, ZH → llbb signatures, respectively. Both experiments
introduced several improvements since the initial searches including more efficient
identification of b-jets, better dijet mass resolution and use of multivariate discriminants that better separate signal from background. Multivariate discriminants,
built from variables that describe the kinematics of the selected events, are used to
maximise the sensitivity to the Higgs boson signal. The signal extraction method
is validated with, for example, the diboson analysis where the nominal multivariate
analysis is modified to extract the VZ, Z → bb diboson process.
ATLAS has observed the mode H → bb by analyzing the combined data from
Run 1 and Run 2 [47], corresponding to an integrated luminosity of 80fb −1 yielding
an observed (expected) significance of 5.4 (5.5) standard deviations, thus providing
direct observation of the Higgs boson decay into b-quarks. The signal strength is
measured to be 1.01 ± 0.12(stat) +0.16 –0.15 (syst). Figure 6.17a shows the distribution
of m bb in data after subtraction of all backgrounds except for the WZ and ZZ ( ∗ )
diboson processes using data taken at
√ s = 13 TeV. The contributions from
all lepton channels, p V T regions, and number-of-jets categories are summed and
Fig. 6.17 (a) Distribution of m bb in data after subtraction of all backgrounds except for the WZ
and ZZ diboson processes, as obtained with the dijet-mass analysis. (b) Fitted values of the Higgs
boson signal strength, μ, for m H = 125 GeV for the WH and ZH processes and their combination,
using the 7 TeV, 8 TeV and 13 TeV data