

2.3 Optimisation of the Synthetic Sequence
27
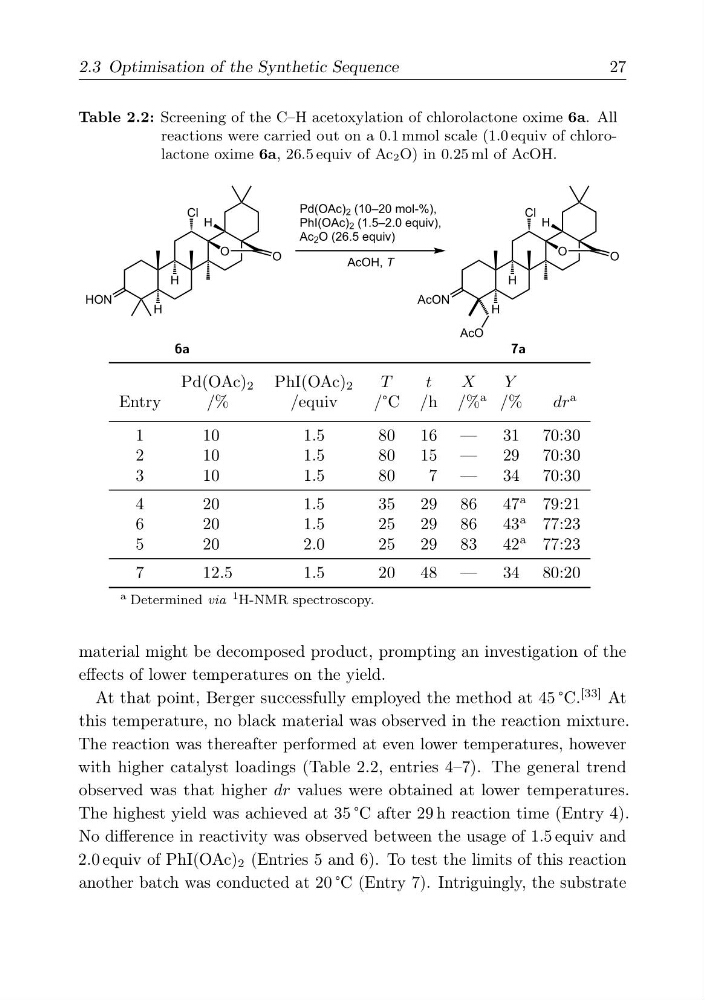
Table 2.2: Screening of the C–H acetoxylation of chlorolactone oxime 6a. All
reactions were carried out on a 0.1 mmol scale (1.0 equiv of chlorolactone oxime 6a, 26.5 equiv of Ac2O) in 0.25 ml of AcOH.
H
H
O
H
Cl
O
H
H
O
H
Cl
O
HON
AcON
AcO
AcOH, T
Pd(OAc) 2 (10–20 mol-%),
PhI(OAc) 2 (1.5–2.0 equiv),
Ac 2 O (26.5 equiv)
6a
7a
Entry
Pd(OAc) 2
/%
PhI(OAc) 2
/equiv
T
/°C
t
/h
X
/%
a
Y
/%
dr
a
1
10
1.5
80
16 —
31 70:30
2
10
1.5
80
15 —
29 70:30
3
10
1.5
80
7 —
34 70:30
4
20
1.5
35
29 86
47
a 79:21
6
20
1.5
25
29 86
43
a 77:23
5
20
2.0
25
29 83
42
a 77:23
7
12.5
1.5
20
48 —
34 80:20
a Determined via
1
H-NMR spectroscopy.
material might be decomposed product, prompting an investigation of the
effects of lower temperatures on the yield.
At that point, Berger successfully employed the method at 45 °C.
[33] At
this temperature, no black material was observed in the reaction mixture.
The reaction was thereafter performed at even lower temperatures, however
with higher catalyst loadings (Table 2.2, entries 4–7). The general trend
observed was that higher dr values were obtained at lower temperatures.
The highest yield was achieved at 35 °C after 29 h reaction time (Entry 4).
No difference in reactivity was observed between the usage of 1.5 equiv and
2.0 equiv of PhI(OAc) 2 (Entries 5 and 6). To test the limits of this reaction
another batch was conducted at 20 °C (Entry 7). Intriguingly, the substrate
27
Table 2.2: Screening of the C–H acetoxylation of chlorolactone oxime 6a. All
reactions were carried out on a 0.1 mmol scale (1.0 equiv of chlorolactone oxime 6a, 26.5 equiv of Ac2O) in 0.25 ml of AcOH.
H
H
O
H
Cl
O
H
H
O
H
Cl
O
HON
AcON
AcO
AcOH, T
Pd(OAc) 2 (10–20 mol-%),
PhI(OAc) 2 (1.5–2.0 equiv),
Ac 2 O (26.5 equiv)
6a
7a
Entry
Pd(OAc) 2
/%
PhI(OAc) 2
/equiv
T
/°C
t
/h
X
/%
a
Y
/%
dr
a
1
10
1.5
80
16 —
31 70:30
2
10
1.5
80
15 —
29 70:30
3
10
1.5
80
7 —
34 70:30
4
20
1.5
35
29 86
47
a 79:21
6
20
1.5
25
29 86
43
a 77:23
5
20
2.0
25
29 83
42
a 77:23
7
12.5
1.5
20
48 —
34 80:20
a Determined via
1
H-NMR spectroscopy.
material might be decomposed product, prompting an investigation of the
effects of lower temperatures on the yield.
At that point, Berger successfully employed the method at 45 °C.
[33] At
this temperature, no black material was observed in the reaction mixture.
The reaction was thereafter performed at even lower temperatures, however
with higher catalyst loadings (Table 2.2, entries 4–7). The general trend
observed was that higher dr values were obtained at lower temperatures.
The highest yield was achieved at 35 °C after 29 h reaction time (Entry 4).
No difference in reactivity was observed between the usage of 1.5 equiv and
2.0 equiv of PhI(OAc) 2 (Entries 5 and 6). To test the limits of this reaction
another batch was conducted at 20 °C (Entry 7). Intriguingly, the substrate