

16 Integration of Detectors into a Large Experiment: Examples from ATLAS. . .
771
20 30 40
2
10
2
10
×
2
3
10
3
10
×
2
[GeV]
jet
T
p
0
0.02
0.04
0.06
0.08
0.1
Fractional JES uncertainty
ATLAS Preliminary
= 0.4, PFlow+JES
R
t
k
anti= 13 TeV
s
Data 2015-2017,
= 0.0
η
Total uncertainty
JES
in situ
Absolute
JES
in situ
Relative
Flav. composition, inclusive jets
Flav. response, inclusive jets
Pile-up, average 2015-2017 conditions
Punch-through, average 2015-2017 conditions
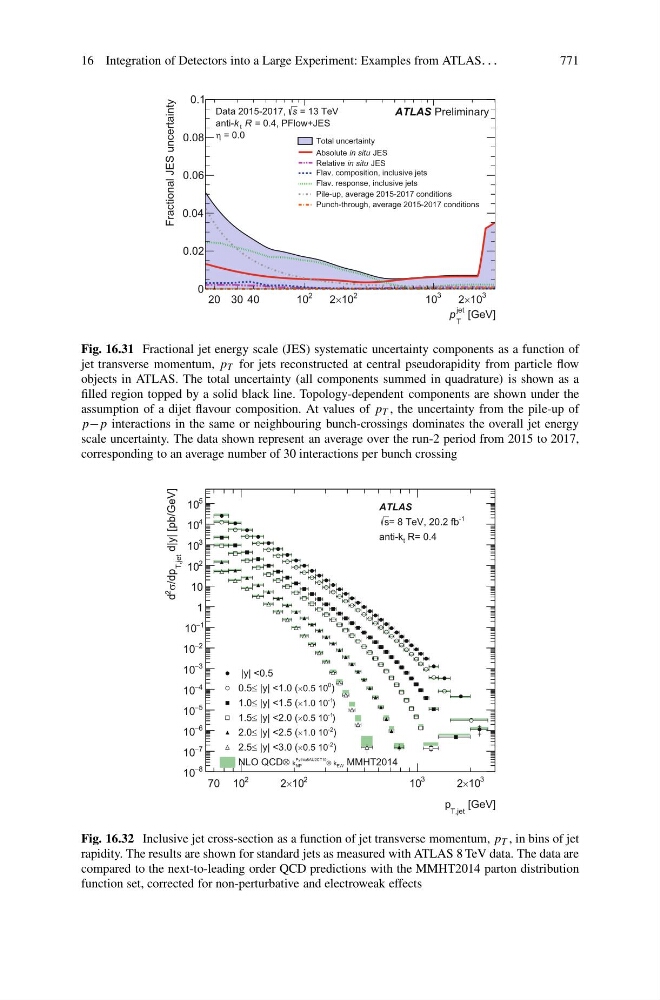
Fig. 16.31 Fractional jet energy scale (JES) systematic uncertainty components as a function of
jet transverse momentum, p T for jets reconstructed at central pseudorapidity from particle flow
objects in ATLAS. The total uncertainty (all components summed in quadrature) is shown as a
filled region topped by a solid black line. Topology-dependent components are shown under the
assumption of a dijet flavour composition. At values of p T , the uncertainty from the pile-up of
p−p interactions in the same or neighbouring bunch-crossings dominates the overall jet energy
scale uncertainty. The data shown represent an average over the run-2 period from 2015 to 2017,
corresponding to an average number of 30 interactions per bunch crossing
[GeV]
T,jet
p
70
2
10
2
10
×
2
3
10
3
10
×
2
d|y| [pb/GeV]
T,jet
/dp
σ
2
d
8
−
10
7
−
10
6
−
10
5
−
10
4
−
10
3
−
10
2
−
10
1
−
10
1
10
2
10
3
10
4
10
5
10
|y| <0.5
)
0
0.5 10
×
|y| <1.0 (
≤
0.5
)
-1
1.0 10
×
|y| <1.5 (
≤
1.0
)
-1
0.5 10
×
|y| <2.0 (
≤
1.5
)
-2
1.0 10
×
|y| <2.5 (
≤
2.0
)
-2
0.5 10
×
|y| <3.0 (
≤
2.5
MMHT2014
EW
k
Pythia8AU2CT10
NP
k
NLO QCD
ATLAS
-1
= 8 TeV, 20.2 fb
s
R= 0.4
t
anti-k
Fig. 16.32 Inclusive jet cross-section as a function of jet transverse momentum, p T , in bins of jet
rapidity. The results are shown for standard jets as measured with ATLAS 8 TeV data. The data are
compared to the next-to-leading order QCD predictions with the MMHT2014 parton distribution
function set, corrected for non-perturbative and electroweak effects