

770
D. Froidevaux
-2
-1
0
1
2
MC
μ
μ
/ m
Data
μ
μ
m
0.996
0.998
1
1.002
1.004
ATLAS
CB muons
=8 TeV
s
-1
L = 20.3 fb
Z
Corrected MC
Uncorrected MC
-2
-1
0
1
2
MC
μ
μ
/ m
Data
μ
μ
m
0.996
0.998
1
1.002
1.004
Υ
η
Leading muon
-2
-1
0
1
2
MC
μ
μ
/ m
Data
μ
μ
m
0.996
0.998
1
1.002
1.004
ψ
J/
Correction uncertainty
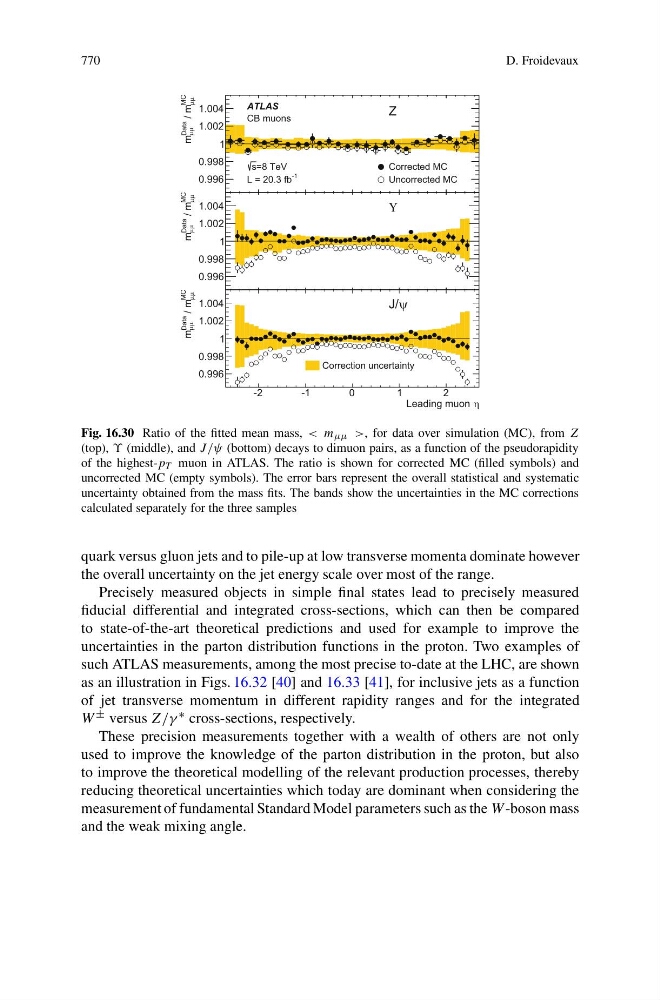
Fig. 16.30 Ratio of the fitted mean mass, < m μμ >, for data over simulation (MC), from Z
(top), ϒ (middle), and J /ψ (bottom) decays to dimuon pairs, as a function of the pseudorapidity
of the highest-p T muon in ATLAS. The ratio is shown for corrected MC (filled symbols) and
uncorrected MC (empty symbols). The error bars represent the overall statistical and systematic
uncertainty obtained from the mass fits. The bands show the uncertainties in the MC corrections
calculated separately for the three samples
quark versus gluon jets and to pile-up at low transverse momenta dominate however
the overall uncertainty on the jet energy scale over most of the range.
Precisely measured objects in simple final states lead to precisely measured
fiducial differential and integrated cross-sections, which can then be compared
to state-of-the-art theoretical predictions and used for example to improve the
uncertainties in the parton distribution functions in the proton. Two examples of
such ATLAS measurements, among the most precise to-date at the LHC, are shown
as an illustration in Figs. 16.32 [40] and 16.33 [41], for inclusive jets as a function
of jet transverse momentum in different rapidity ranges and for the integrated
W ± versus Z/γ ∗ cross-sections, respectively.
These precision measurements together with a wealth of others are not only
used to improve the knowledge of the parton distribution in the proton, but also
to improve the theoretical modelling of the relevant production processes, thereby
reducing theoretical uncertainties which today are dominant when considering the
measurement of fundamental Standard Model parameters such as the W -boson mass
and the weak mixing angle.