

11 Detector Simulation
515
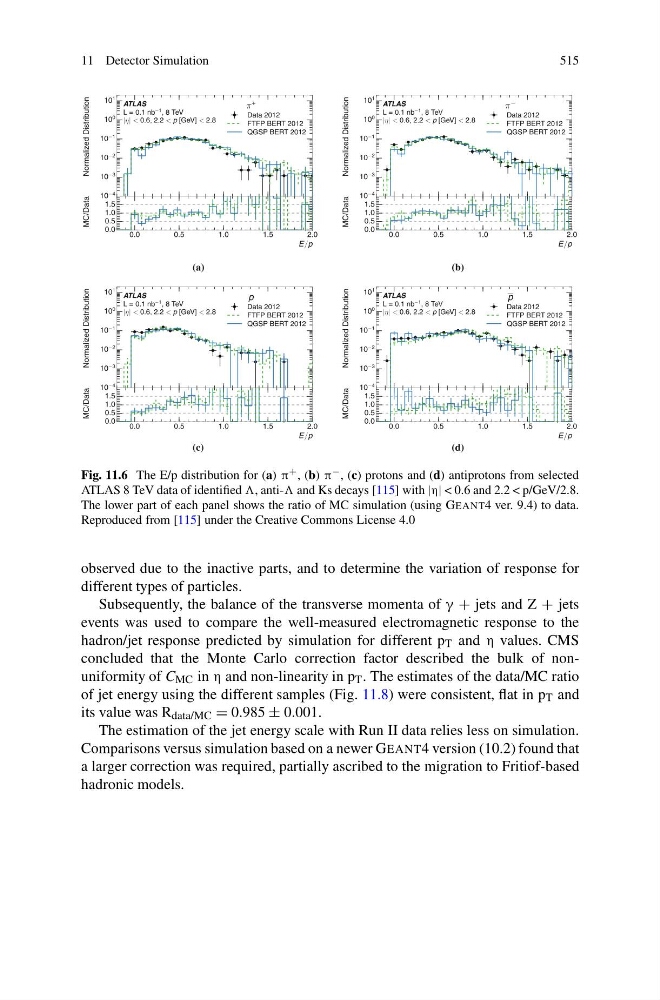
Fig. 11.6 The E/p distribution for (a) π + , (b) π − , (c) protons and (d) antiprotons from selected
ATLAS 8 TeV data of identified , anti- and Ks decays [115] with |η| < 0.6 and 2.2 < p/GeV/2.8.
The lower part of each panel shows the ratio of MC simulation (using GEANT4 ver. 9.4) to data.
Reproduced from [115] under the Creative Commons License 4.0
observed due to the inactive parts, and to determine the variation of response for
different types of particles.
Subsequently, the balance of the transverse momenta of γ + jets and Z + jets
events was used to compare the well-measured electromagnetic response to the
hadron/jet response predicted by simulation for different p T and η values. CMS
concluded that the Monte Carlo correction factor described the bulk of nonuniformity of C MC in η and non-linearity in p T . The estimates of the data/MC ratio
of jet energy using the different samples (Fig. 11.8) were consistent, flat in p T and
its value was R data/MC = 0.985 ± 0.001.
The estimation of the jet energy scale with Run II data relies less on simulation.
Comparisons versus simulation based on a newer GEANT4 version (10.2) found that
a larger correction was required, partially ascribed to the migration to Fritiof-based
hadronic models.
515
Fig. 11.6 The E/p distribution for (a) π + , (b) π − , (c) protons and (d) antiprotons from selected
ATLAS 8 TeV data of identified , anti- and Ks decays [115] with |η| < 0.6 and 2.2 < p/GeV/2.8.
The lower part of each panel shows the ratio of MC simulation (using GEANT4 ver. 9.4) to data.
Reproduced from [115] under the Creative Commons License 4.0
observed due to the inactive parts, and to determine the variation of response for
different types of particles.
Subsequently, the balance of the transverse momenta of γ + jets and Z + jets
events was used to compare the well-measured electromagnetic response to the
hadron/jet response predicted by simulation for different p T and η values. CMS
concluded that the Monte Carlo correction factor described the bulk of nonuniformity of C MC in η and non-linearity in p T . The estimates of the data/MC ratio
of jet energy using the different samples (Fig. 11.8) were consistent, flat in p T and
its value was R data/MC = 0.985 ± 0.001.
The estimation of the jet energy scale with Run II data relies less on simulation.
Comparisons versus simulation based on a newer GEANT4 version (10.2) found that
a larger correction was required, partially ascribed to the migration to Fritiof-based
hadronic models.