

514
J. Apostolakis
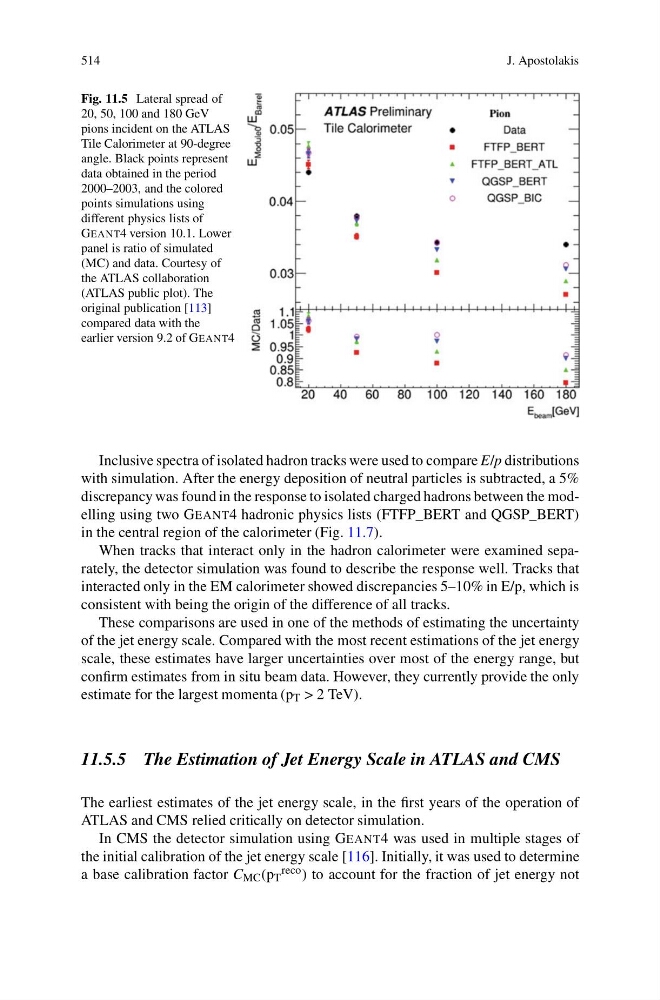
Fig. 11.5 Lateral spread of
20, 50, 100 and 180 GeV
pions incident on the ATLAS
Tile Calorimeter at 90-degree
angle. Black points represent
data obtained in the period
2000–2003, and the colored
points simulations using
different physics lists of
GEANT4 version 10.1. Lower
panel is ratio of simulated
(MC) and data. Courtesy of
the ATLAS collaboration
(ATLAS public plot). The
original publication [113]
compared data with the
earlier version 9.2 of GEANT4
Inclusive spectra of isolated hadron tracks were used to compare E/p distributions
with simulation. After the energy deposition of neutral particles is subtracted, a 5%
discrepancy was found in the response to isolated charged hadrons between the modelling using two GEANT4 hadronic physics lists (FTFP_BERT and QGSP_BERT)
in the central region of the calorimeter (Fig. 11.7).
When tracks that interact only in the hadron calorimeter were examined separately, the detector simulation was found to describe the response well. Tracks that
interacted only in the EM calorimeter showed discrepancies 5–10% in E/p, which is
consistent with being the origin of the difference of all tracks.
These comparisons are used in one of the methods of estimating the uncertainty
of the jet energy scale. Compared with the most recent estimations of the jet energy
scale, these estimates have larger uncertainties over most of the energy range, but
confirm estimates from in situ beam data. However, they currently provide the only
estimate for the largest momenta (p T > 2 TeV).
11.5.5 The Estimation of Jet Energy Scale in ATLAS and CMS
The earliest estimates of the jet energy scale, in the first years of the operation of
ATLAS and CMS relied critically on detector simulation.
In CMS the detector simulation using GEANT4 was used in multiple stages of
the initial calibration of the jet energy scale [116]. Initially, it was used to determine
a base calibration factor C MC (p T
reco ) to account for the fraction of jet energy not
J. Apostolakis
Fig. 11.5 Lateral spread of
20, 50, 100 and 180 GeV
pions incident on the ATLAS
Tile Calorimeter at 90-degree
angle. Black points represent
data obtained in the period
2000–2003, and the colored
points simulations using
different physics lists of
GEANT4 version 10.1. Lower
panel is ratio of simulated
(MC) and data. Courtesy of
the ATLAS collaboration
(ATLAS public plot). The
original publication [113]
compared data with the
earlier version 9.2 of GEANT4
Inclusive spectra of isolated hadron tracks were used to compare E/p distributions
with simulation. After the energy deposition of neutral particles is subtracted, a 5%
discrepancy was found in the response to isolated charged hadrons between the modelling using two GEANT4 hadronic physics lists (FTFP_BERT and QGSP_BERT)
in the central region of the calorimeter (Fig. 11.7).
When tracks that interact only in the hadron calorimeter were examined separately, the detector simulation was found to describe the response well. Tracks that
interacted only in the EM calorimeter showed discrepancies 5–10% in E/p, which is
consistent with being the origin of the difference of all tracks.
These comparisons are used in one of the methods of estimating the uncertainty
of the jet energy scale. Compared with the most recent estimations of the jet energy
scale, these estimates have larger uncertainties over most of the energy range, but
confirm estimates from in situ beam data. However, they currently provide the only
estimate for the largest momenta (p T > 2 TeV).
11.5.5 The Estimation of Jet Energy Scale in ATLAS and CMS
The earliest estimates of the jet energy scale, in the first years of the operation of
ATLAS and CMS relied critically on detector simulation.
In CMS the detector simulation using GEANT4 was used in multiple stages of
the initial calibration of the jet energy scale [116]. Initially, it was used to determine
a base calibration factor C MC (p T
reco ) to account for the fraction of jet energy not