

11 Detector Simulation
513
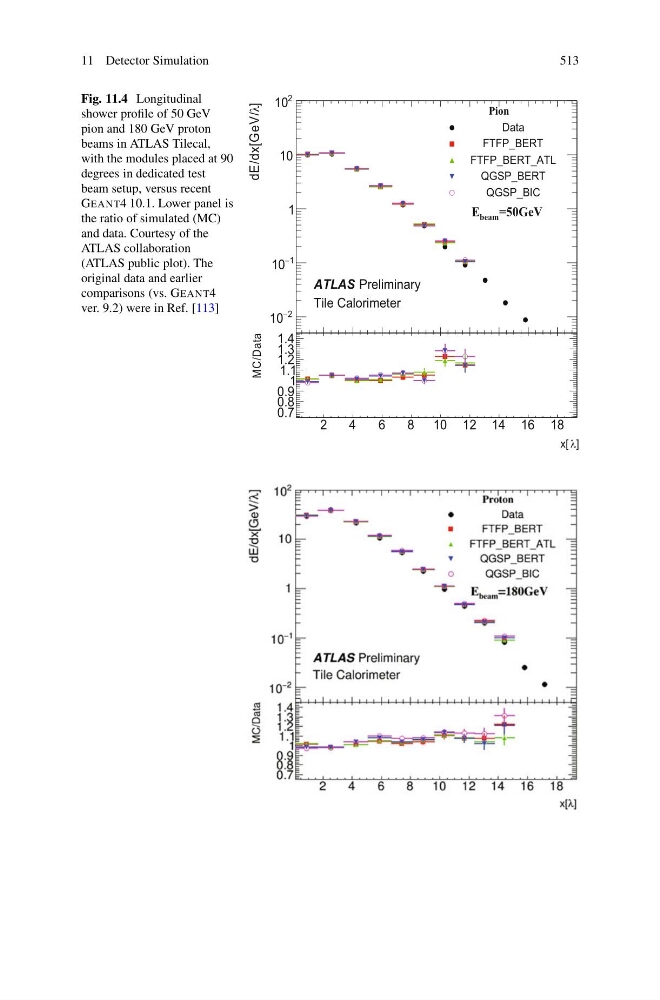
Fig. 11.4 Longitudinal
shower profile of 50 GeV
pion and 180 GeV proton
beams in ATLAS Tilecal,
with the modules placed at 90
degrees in dedicated test
beam setup, versus recent
GEANT4 10.1. Lower panel is
the ratio of simulated (MC)
and data. Courtesy of the
ATLAS collaboration
(ATLAS public plot). The
original data and earlier
comparisons (vs. GEANT4
ver. 9.2) were in Ref. [113]
]
dE/dx[GeV/λ
2
–
10
1
–
10
1
10
2
10
Pion
Data
FTFP_BERT
FTFP_BERT_ATL
QGSP_BERT
QGSP_BIC
λ]
x[
2
4
6
8 10 12 14 16 18
MC/Data
0.7
0.8
0.9
1
1.1
1.2
1.3
1.4
=50GeV
beam
E
ATLAS Preliminary
Tile Calorimeter
513
Fig. 11.4 Longitudinal
shower profile of 50 GeV
pion and 180 GeV proton
beams in ATLAS Tilecal,
with the modules placed at 90
degrees in dedicated test
beam setup, versus recent
GEANT4 10.1. Lower panel is
the ratio of simulated (MC)
and data. Courtesy of the
ATLAS collaboration
(ATLAS public plot). The
original data and earlier
comparisons (vs. GEANT4
ver. 9.2) were in Ref. [113]
]
dE/dx[GeV/λ
2
–
10
1
–
10
1
10
2
10
Pion
Data
FTFP_BERT
FTFP_BERT_ATL
QGSP_BERT
QGSP_BIC
λ]
x[
2
4
6
8 10 12 14 16 18
MC/Data
0.7
0.8
0.9
1
1.1
1.2
1.3
1.4
=50GeV
beam
E
ATLAS Preliminary
Tile Calorimeter